

A cohort retention analysis is a helpful tool for product teams to understand how many of their users return to their product and after what period of time.
Aptrinsic is now Gainsight PX! Gainsight PX helps your team deliver superior product experiences while Gainsight’s customer success platform helps to ensure customers are receiving business value from the product.
In this article we’ll cover two specific questions you can answer using a cohort retention analysis, “what is my window of time to deliver an aha moment to my users?” and “has my product achieved product market fit?”. Both are critical to know in order to deliver the best customer experience and successful product.
What is my window of time to deliver an aha moment to my users?
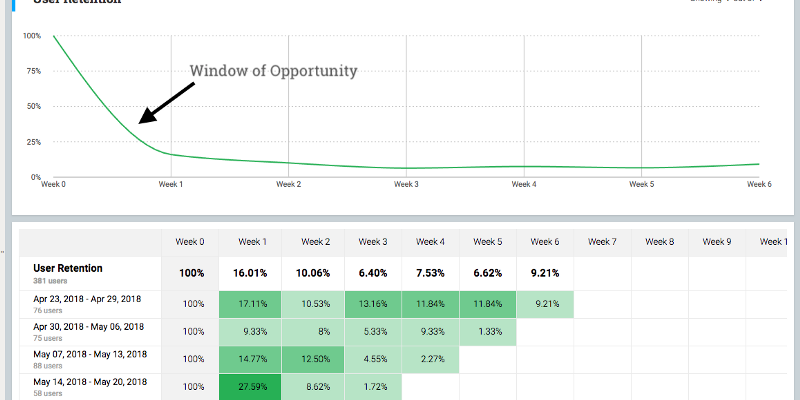
To determine the window of time you have to deliver an aha moment to your users, you can look to the slope of the user retention curve. Using the example below you can see that we’ve retained only 16% of our users after the first week. The steepness of the curve indicates that it’s within this window of time that we loose the most users. So we’ve got less than 7 days to help users find value in our product.
A weekly time frame is a good range for less transactional or business applications. For more consumer apps, you’ll want to measure your cohorts in days.
When you have different personas or types of users in product, you’ll want to review the user retention report for each cohort as they will have different usage patterns.
Has my product achieved Product Market Fit?
When your product has achieved product market fit, your user retention will flatten out over time. If the line trends towards zero, users are not realizing value in your offering and not returning back to your product. This trend line down to 0 is also described as a having leaky bucket. No matter how good your customer acquisition is doing, ultimately you’re in trouble if you cannot deliver value and keep users coming back.
Your ideal user retention graph will look like a smile. This means that over time, you’re giving your users more reason to come back and adopt your product. This can come from executing specific re-engagement campaigns through email to help a user complete a task or even as a result of introducing new product capabilities that users want.