Product Experience Platform
Unlock sustainable growth from acquisition through expansion
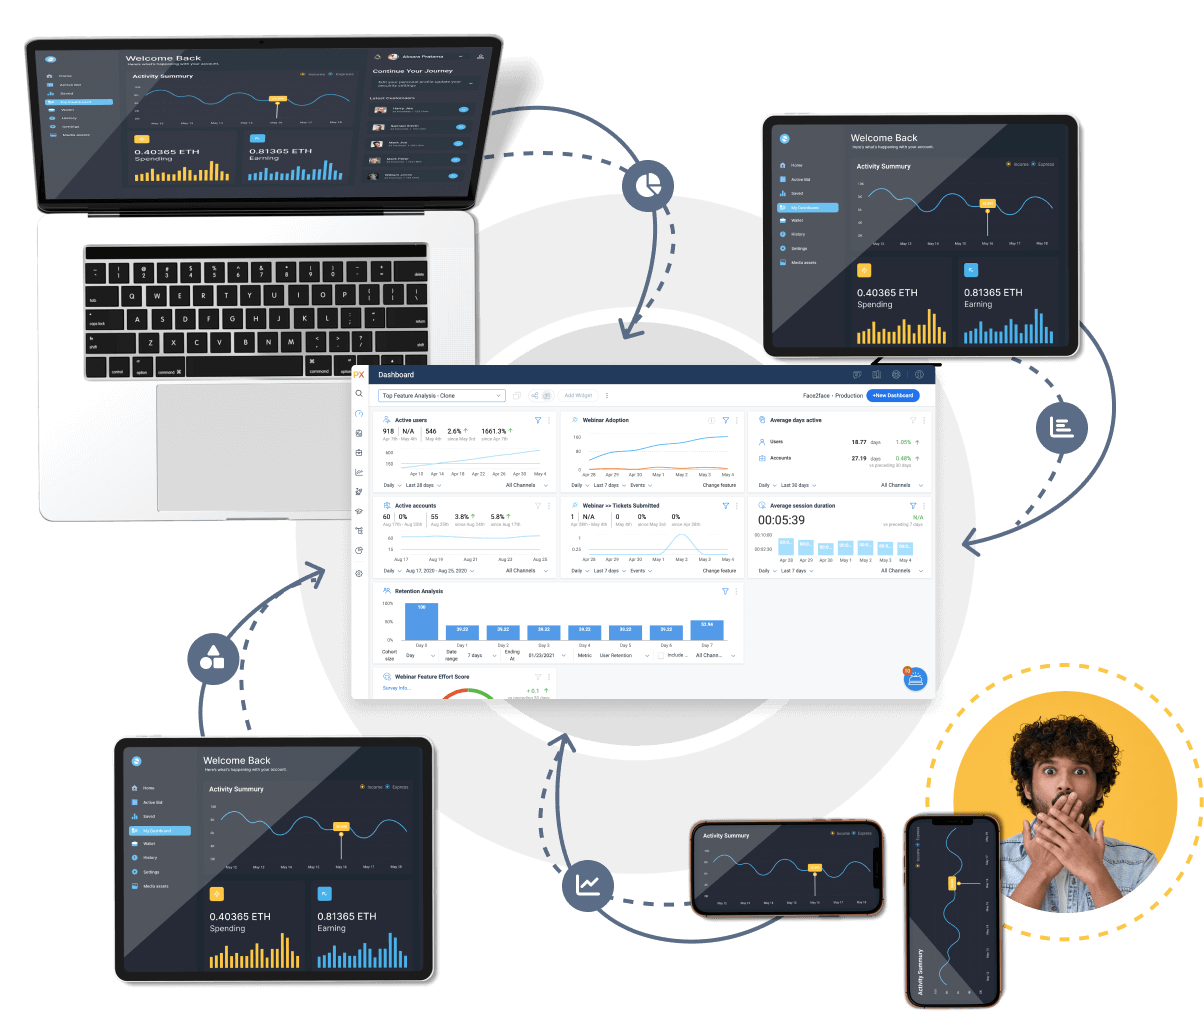
Gainsight’s digital product experience platform augments your customers’ product experiences by giving your brand the tools to make data-driven decisions to reduce churn, increase adoption, and create growth opportunities.
Trusted by leading product teams worldwide
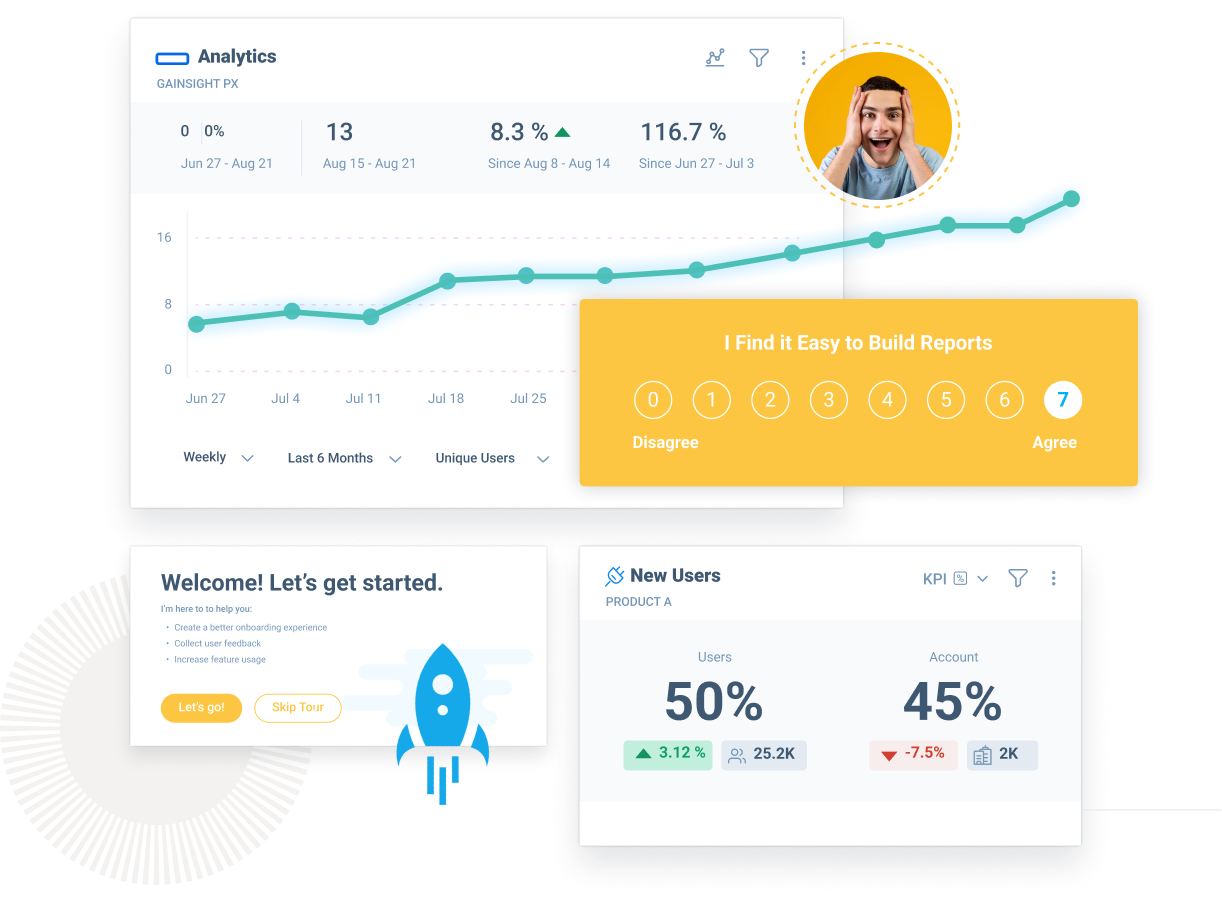
Advanced Product Analytics
Data-driven roadmap prioritization to increase user engagement
-
Our product experience tools provide autonomous feature instrumentation to reveal the best opportunities for growth
-
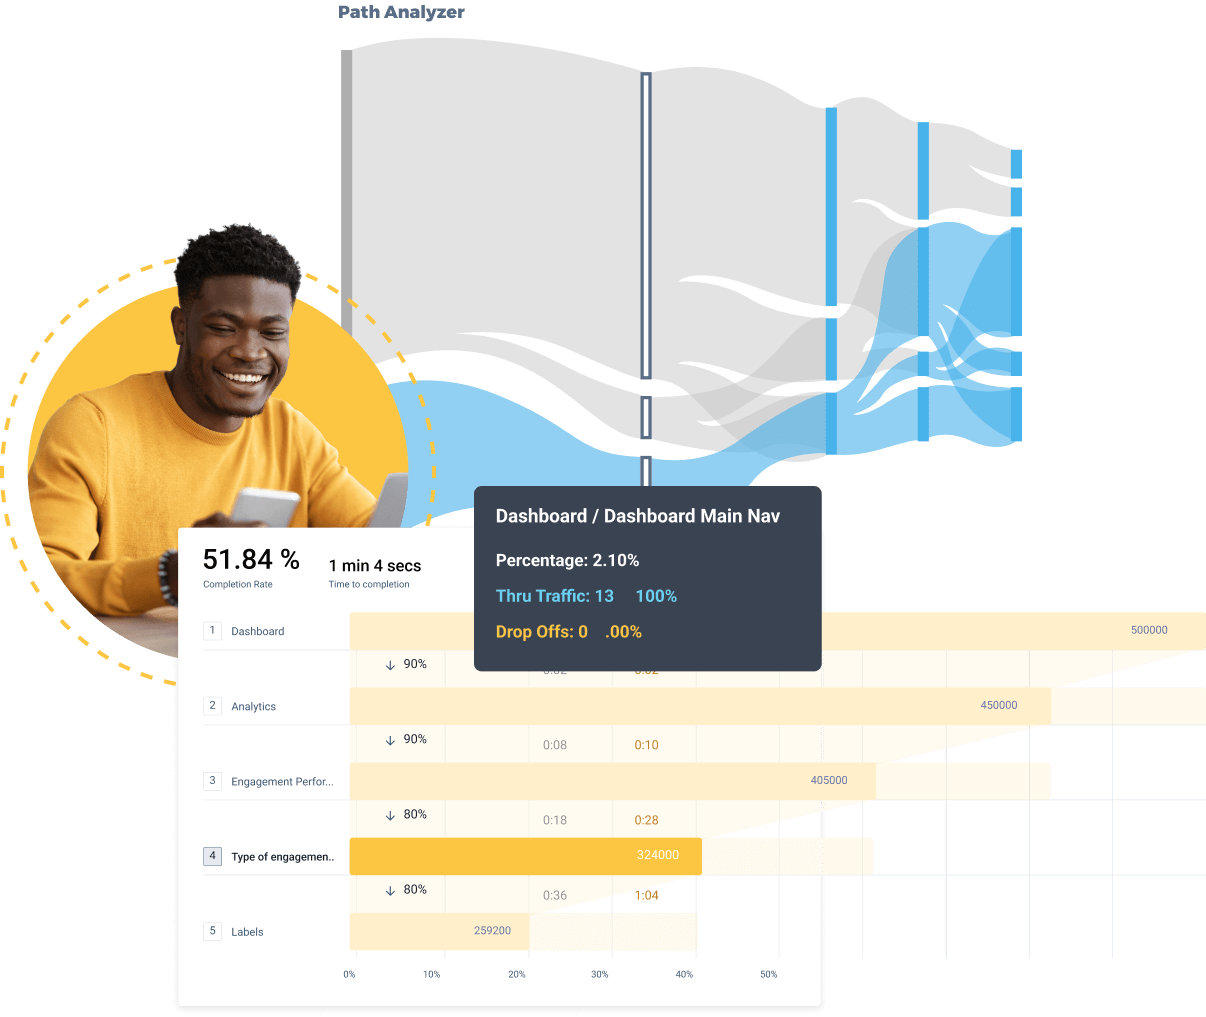
Path and funnel analysis to shadow user behavior, identify friction points and mitigate adoption risk
-
Native integrations with CS and CRM to tie product investments to bookings, retention, expansion
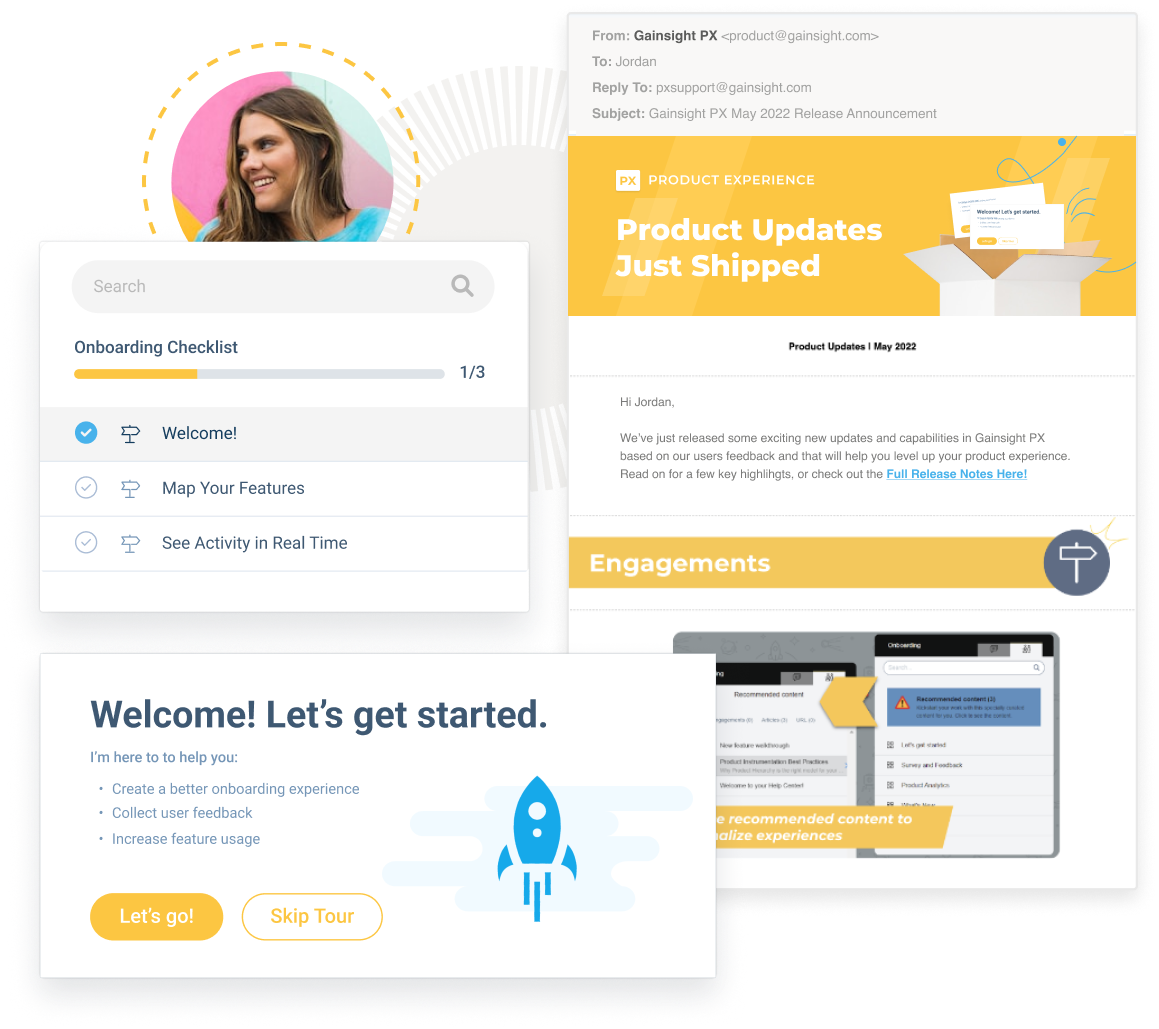
Native Omni-Channel Engagement
Scaling onboarding and driving product adoption
-
The product experience platform enables easy editing for in-app engagements and onboarding checklists
-
Native email campaigns to accelerate user activation and increase release awareness
-
Advanced throttling and prioritization to avoid user fatigue and maximize engagement
Closed-Loop Feedback
Broader user input and immediate action on feedback
-
Our digital product experience platform delivers in-app surveys with intelligent targeting
-
CES (Customer Effort Score) surveys to measure feature usability
-
CSAT and NPS surveys to focus advocacy programs and risk mitigation programs

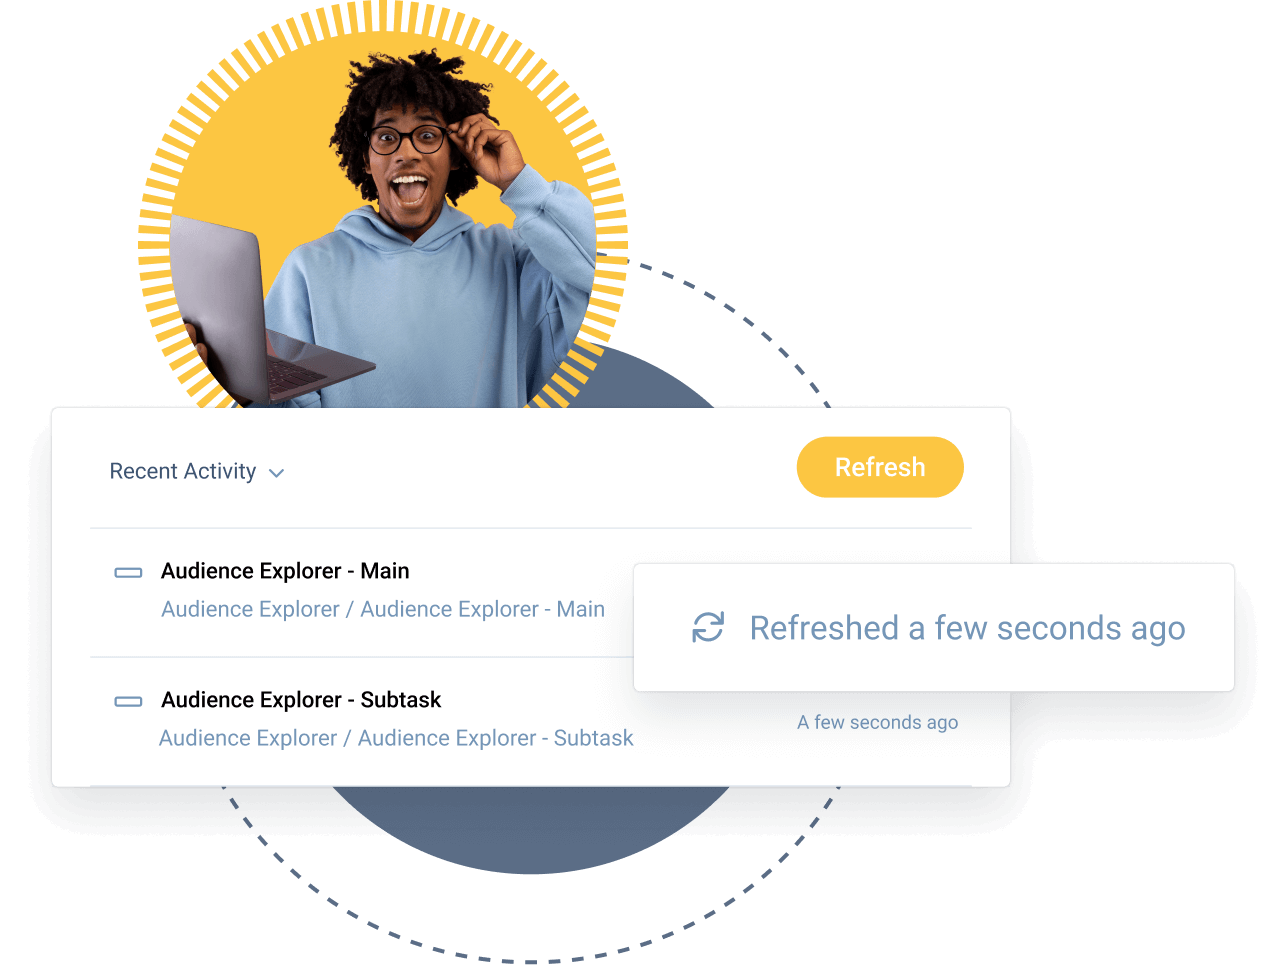
Up-to-the Second Data
Better decisions and rapid iteration
-
Our product experience app ensures data-freshness measured in seconds
-
Advanced segmentation to drive personalized engagement without degrading performance
-
Zero performance impact tracking billions of events per day
SaaS, Mobile, Desktop
A single view of your entire portfolio, regardless of runtime
-
Our product experience tool supports multiple runtimes, including Native iOS, Android, ReactNative, and Windows-desktop
-
Deep product usage telemetry that drastically reduces Time-to-Resolution (TTR)
-
Native C# and Java SDKs for custom desktop apps
Customer Trust
Build trust with consistent, human-first experiences
Our product experience tools allow you to personalize experiences by providing relevant onboarding journeys, in-app guidance, and timely interventions based on how customers interact with your products. This approach will help your business build meaningful connections and long-lasting relationships by engaging customers and demonstrating value to turn passive users into loyal brand ambassadors.
Product-Led Growth
Connect product experience to business growth
Gainsight’s product experience app helps you understand your offerings’ value by gauging what users do and don’t do and how they interact with them. It lets you determine what stops customers from returning and how to address these issues to sell more. By optimizing the product experience, you can positively influence customer lifetime value, which will further your brand’s business growth prospects.
PX MCP Server: Talk to your PX data like it’s a teammate
With the PX MCP Server you get answers from your PX data instantly so you can spend less time building reports and more time driving adoption.
Don't Just Take Our Word for It


FAQs about Product Experience platform
A product experience platform tracks how customers interact with products, revealing preferred features and pain points. It enables guided tours and targeted messaging to enhance user journeys. By understanding behavior patterns, you can predict churn, segment users, and address issues proactively, connecting insights to business outcomes like growth and retention.
Gainsight’s product experience platform helps SaaS teams understand user behavior and enhance adoption. Customer success prevents churn, designers improve usability, marketing creates targeted campaigns, and product managers prioritize features. Growth teams expand accounts while leaders make investment decisions. Our digital product experience platform enables data sharing for improved collaboration.
Unlike conventional analytics focusing on metrics, our product experience platform determines why things happen and remedies issues. Gainsight’s product experience tools deliver real-time insights that connect to business results. Our product experience app unifies insights and actions in one platform, making it proactive by providing context and predicting customer needs.
With our product experience app, analyze behavior patterns immediately. See usage trends within two weeks, measure retention within 30-60 days, and track expansion revenue within 90 days. Gainsight’s product experience platform delivers greater value over time as it collects more data for predictive modeling.
Gainsight’s digital product experience platform revolutionizes onboarding with personalized learning paths based on user profiles. In-product guides ensure relevant guidance for initial success. It tracks progress, assesses strategies, and signals intervention needs. Our product experience platform collects feedback to refine onboarding and address pain points.