
Allison Pickens is VP of Customer Success & Business Operations at Gainsight
Why should you learn to build a financial model? You’re in Customer Success, not Finance.
Think again. It’s critical for executives to understand the economics of their team. You need to be able to educate the Finance team about how to forecast key CSM metrics. You also need to be able to manage your team to achieve certain financial metrics, and to understand how various initiatives can affect those numbers.
Here’s a financial model that I built for our team (Googledoc). Don’t worry: the numbers aren’t real. I’m providing this as a template, so that you can create your own model.
The Basics
A few principles for building a financial model:
- Highlight your assumptions. Those are highlighted in yellow in the model.
- All cells in black font should be formulas based on numbers in other cells. Never insert a raw number into a formula (e.g. =B5 + 10). All your assumptions should be highlighted in yellow.
- Put time periods in the columns; put metrics in the rows.
- Keep your model organized. Divide it into sections. Bold the most important metrics.
- Create a section for every Customer Tier.
Step 1: Determine the output
The output of my financial model is the net fully loaded cost of CSM, divided by ARR. You’ll recall from my earlier blog post that I’m aiming for a 15% cost of CSM/ARR – in other words, I want to spend 15 cents on Customer Success for every $1 of ARR.
Step 2: Project Your ARR
This section of the model forecasts total ARR managed by a particular Customer Tier, including the effects of churn, upsell, and new customers.
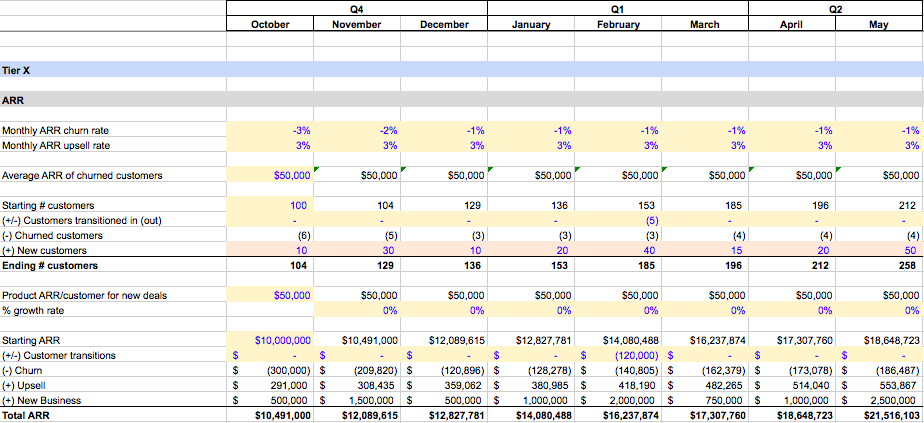
I inserted a few key assumptions:
- Monthly churn rate:
- I could project a decrease if our board has asked for improved targets for churn, or if I believe that our process improvements will reduce churn in the future.
- If your business is mostly comprised of annual contracts, and if your sales team tends to close deals at the end of the quarter, then you’ll want to make the churn rate higher in the last month of the quarter.
- Average ARR of churned customers: Who is likely to churn? The answer is often smaller accounts.
- Monthly upsell rate: The same comments apply for upsell as for churn.
- Customers transitioned in/out: If you’re re-organizing your customer tiers, then indicate here how many customers you’ll transition into or out of another tier.
- New customers: Get a report from your Sales team that forecasts pipeline in each of your customer tiers. If your Sales team uses Salesforce, you can subscribe to their pipeline dashboard.
- ARR/customer: How large are the Sales team’s new deals? Do they expect to change their strategy for pricing, packaging, or discounting in the future?
Step 3: Project Your Costs
The output of this section is the fully loaded cost of the CSMs within the particular Customer Tier, as well as the fully loaded cost / ARR ratio.

Assumptions you’ll have to make:
- CSMs hired: Input how many CSMs you plan to hire in each month. You aim to should hire CSMs only when your net fully loaded cost / ARR ratio falls below 15%. That said, you might be willing to tolerate a high ratio for a period of time in order to accomplish some other company goal: increasing your NPS, increasing the frequency of customers offering sales references, etc.
- Average OTE / CSM: OTE means on-target earnings. This includes both base and bonus (or any commissions).
- Overhead: To simplify the model, I’ve assumed 20% overhead to cover benefit, office space, IT, etc. Note that I’m including a separate section for management and operations costs, discussed below.
Step 4: Project Your ARR from Premier CSM
Some CSM teams charge for higher levels of Customer Success. This helps them offset their costs. You might charge for Customer Success in some customer tiers but not others.
The following section of the model helps you arrive at a net fully loaded cost of CSM / ARR ratio, in which the numerator (cost) is offset by ARR from the Premier CSM offering, for the given Customer Tier.
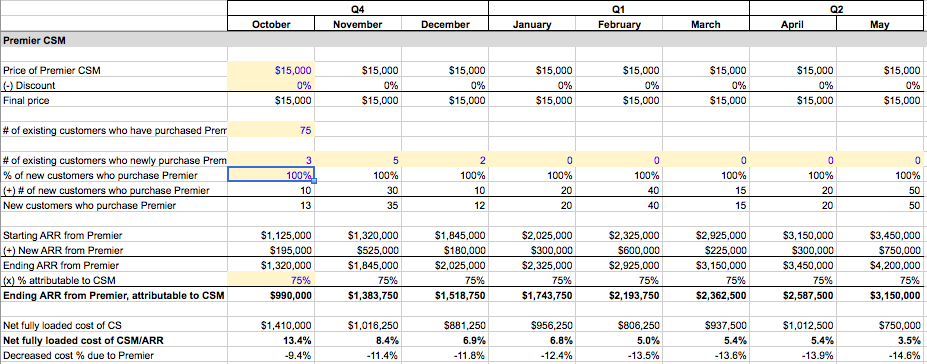
Assumptions you’ll have to make:
- Price of Premier CSM, and by what percentage it tends to be discounted: If you’re smart, you’ll create a policy with your Sales or Renewals/Expansion team so that sales managers cannot discount Premier.
- # of existing customers who newly purchase Premier: Forecast upsells of Premier to existing customers.
- % of new customers who purchase Premier: You’ll want this to be as high as possible. You might create a policy to mandate that customers with Product ARR that’s above a certain level are required to purchase Premier or else Premier ARR will be carved out of Product ARR.
- % attributable to CSM: Sometimes Premier offerings include Support as well as CSM. Work with your Finance team to understand what percentage of the Premier price you can attribute to CSM.
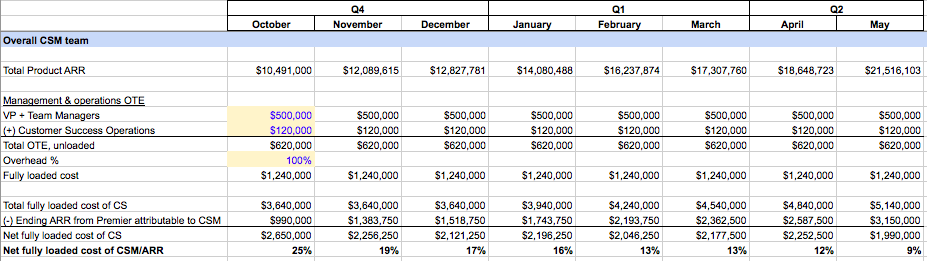
Step 5: Add Management and Operations Costs
Include any costs from non-CSM members of your team in this section, including yourself, managers of the tiers, and Customer Success Operations. Naturally, you’ll have just 1 section like this in your model; you won’t replicate this section for every Customer Tier (as you will for the sections above).
Final output: the net fully loaded cost of CSM / ARR, including all customer tiers and including the cost of management.
If you have any questions about this blog post, or if you’d like to offer feedback, feel free to email Allison at apickens@gainsight.com. You can also follow her weekly blog posts on Twitter at @PickensAllison.