Retention Analysis: Tutorial & Best Practices
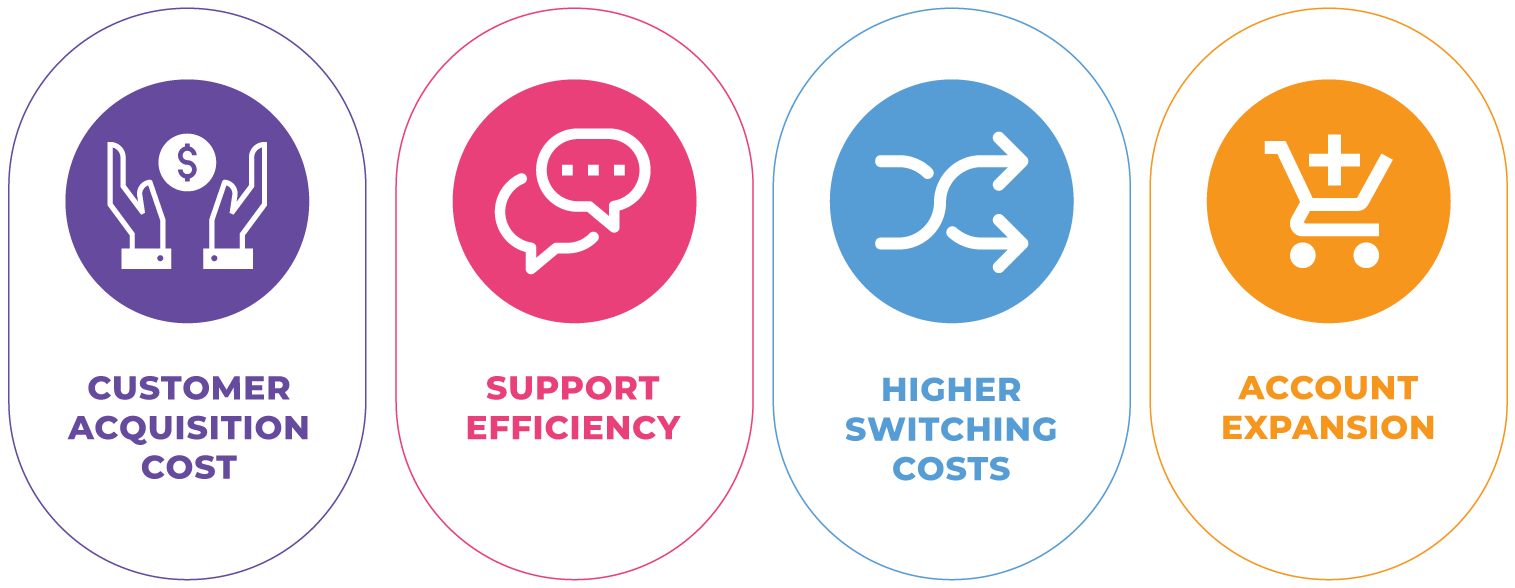
Since moving from away from local software installations to the SaaS model, retention has become the lifeblood of software product businesses. With this shift in models switching between products is easier than ever since switching costs are significantly lower, and new competitors arise frequently. Retaining customers, and users at those customers in the case of B2B SaaS, is important for a number of reasons:

- Customer Acquisition Cost: It is far less expensive to retain existing customers than to acquire new ones.
- Support Efficiency: The longer you retain customers, the less you need to provide them support and other services. As a result, they become less expensive to maintain.
- Higher Switching Costs: The longer your product is embedded in a customer’s daily processes, the higher switching costs become, making the account’s revenue more reliable.
- Account Expansion: With B2B, if users have embedded your product in their daily workflows, account expansion becomes a natural next step and customers are more likely to expand additional seat licenses or purchase new products in cross-sell motions.
Client and user retention is incredibly important for the long-term viability of both products and the companies that produce them. Learning how to analyze the factors that affect retention is not necessarily simple, but it’s not rocket science either, and it can give you enormous insight into the features to prioritize so your customers don’t leave.
How to understand retention in five steps
While evaluating retention can be daunting, this is one of the most important analyses you can do as a business. Here’s how to get started.
| Set up measurement of user behavior and sentiment | Analyzing retention is about more than just knowing if customers are retained—it’s about understanding why customers keep coming back.
Developing systems to measure user engagement means that you can quantitatively assess which features are most impactful for customers and gathering sentiment means you can tie usage to positive user value. |
| Determine key retention metrics | These critical metrics are unique to each product and should be refined over time. |
| Gather feedback insights | Quantitative analysis is crucial, but getting qualitative feedback prior to a customer churning can help you avert losing a customer. |
| Test churn reduction strategies | Like other product metrics, reducing churn requires some trial and error to arrive at effective methods. |
| Refine and repeat | As you find effective methods to retain customers, keep refining to maximize revenue from existing accounts. |
Retention in depth
Analyzing retention is more than tracking a single metric; rather, it’s about getting a full picture of a client’s or user’s health. This evaluation helps determine a client’s likely contribution to the company’s bottom line over time.
In business models that rely on subscriptions, retention is crucial to profitability. Instead of selling your product and realizing revenue once, companies must continuously prove value to customers to avoid losing them. In addition, there’s a cruel math that SaaS companies confront: Customers must produce more revenue than they cost to acquire and maintain.
Most importantly, however, performing an in-depth analysis of how product feature usage correlates to retention is the first step to improving customer retention and realizing the many benefits that come with it.
Metrics to measure retention
Churn rate
Churn rate is calculated using this formula:

Churn is the “North Star” metric of customer retention efforts. Regardless of how sophisticated your product analysis becomes, if churn isn’t decreasing, your current methods are not having the intended effect.
Churn rates can be calculated based on different time frames, such as weekly, monthly, or quarterly active users. Setting a threshold that defines when a user is active is important; the number chosen should relate back to your product’s key value drivers.
When defining this metric, you need to specify a threshold that determines whether or not a user or account has churned. Don’t rely on official account cancellations to set this value: Client behavior will change well ahead of account cancelation. For some products, users never cancel their accounts even though they stop using the product.
In addition, because new users and clients sign up throughout the year, defining churn based on a rolling time frame can often work best for analysis. This timeframe should correlate to how frequently you expect the product to be used. Daily-use products like social apps may want to consider a short period for measuring churn. A time management product might define its threshold for churn as users who haven’t logged time in the app in the past 30 days. For example, a personal tax prep product would need to look at usage on an annual basis, or would see pretty disappointing churn numbers if using a shorter time frame.
According to Hubspot, healthy churn rates for B2C products are typically in the 2-8% range. For B2B SaaS companies, the threshold is higher, and product leaders should target a churn rate below 2%. Research conducted by Bain & Company suggests that increasing customer retention rates by 5% increases profits by 29-95%.
If your churn rate is above your target, the next step is to understand which customer segments are contributing most to churn and prioritizing strategies that will keep those users engaged.
User engagement
The user engagement score is a sum of significant events experienced by a single user or a segment of users and measures overall usage in a journey. For example:
![]()
Higher weights should be assigned to the usage of golden features that provide the most customer value or to other important milestones that occur less frequently. Because this metric is defined individually by companies or product managers, there isn’t any benchmark for a desirable customer engagement score.
This score is valuable as a way to predict when customers might churn. After defining the user engagement score, link the score to churn rates of customers after a certain number of days to understand the thresholds that correlate to lower churn rates.
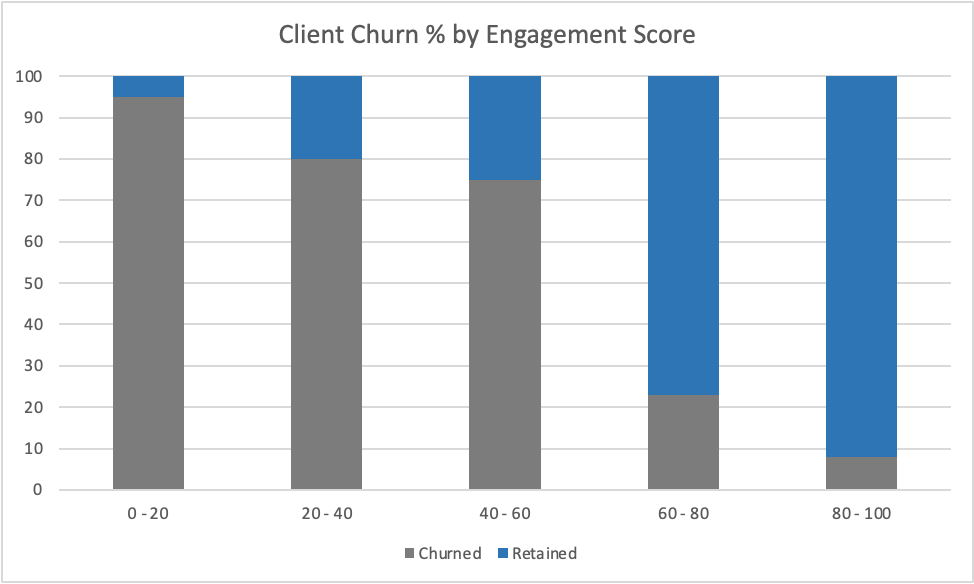
Looking at customers who signed up in the past year, a product manager can plot a stacked percentage bar graph of retained vs. churned users. By identifying the point where churn drastically improves, it’s possible to identify the product’s target engagement score.

In this scenario, the product manager would likely want to analyze clients within the 60-80% score range in more detail by further segmenting that band.

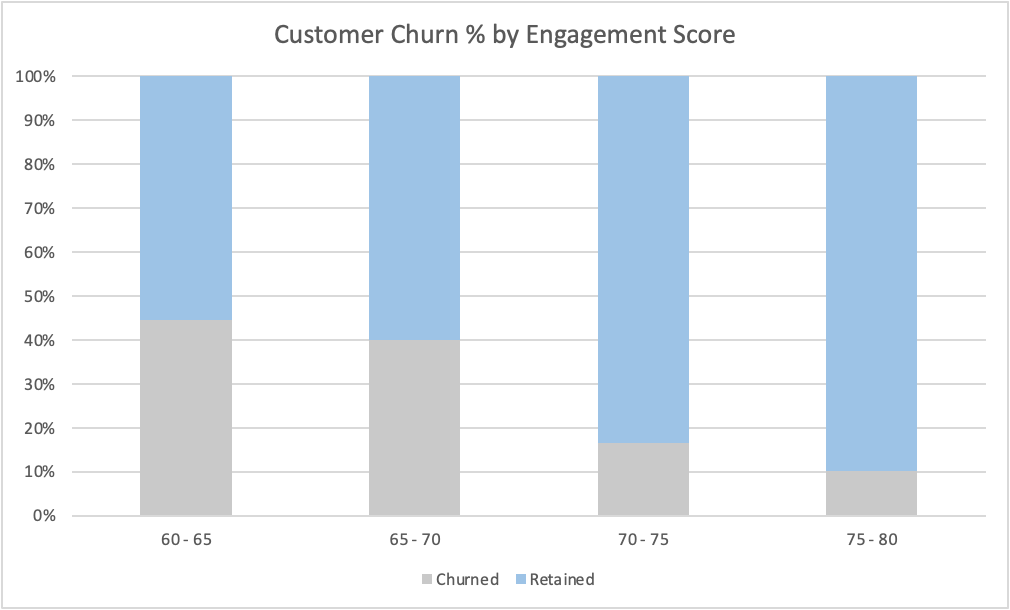
Continuing the above scenario, additional segmentation may show a breakpoint in churn vs. customer engagement score within that 60-80% range, here shown at a score of 70. In this example, getting customers to a 70% engagement score is correlated with far lower churn than accounts below that point.
Customer journey analysis
While the customer engagement score is a helpful assessment of an account’s likelihood of churning, customer journey analysis helps you understand why clients churn. While there isn’t any simple metric associated with analyzing the customer journey, this is one of the most crucial components of understanding retention. This is where using a product analytics tool can really help identify the friction points that lead to higher churn rates.
|
Platform
|
Out-of-the-Box KPIs
|
Segmentation
|
Feature-Level Adoption & Retention Analysis
|
Cross-Channel User Engagements
|
Engagement Impact Analysis
|
A.I-Powered Product Feature Mapping
|
Mobile Application Support
|
|---|---|---|---|---|---|---|---|
|
Gainsight
|
✔
|
✔
|
✔
|
✔
|
✔
|
✔
|
✔
|
|
Heap
|
✔
|
✔
|
✔
|
✔
|
|||
|
Pendo
|
✔
|
✔
|
Some helpful data sources on customer friction include the following:
- Analytical tools like the Gainsight PX Path Analyzer: By seeing how users move through the app, product managers can maximize their impact by meeting customers where they are in the product.
- User survey feedback: Through regular user surveys conducted via email or within the product experience, your team can understand where customers are experiencing friction within your product.
- Customer effort score (CES): In-app surveys can be used to determine if users are challenged using non-inuitive product features. In-context user feedback can help product managers refine the user experience (UX) and improve CES.
- The customer support team: Identifying recurring problems reported through support is a goldmine for finding product friction areas.
By tracking events like users encountering errors or facing friction within the app and mapping that back to churn, companies can ensure that they are taking steps to prioritize improvements and bug fixes that will minimize events strongly correlated with churn. Segmenting users into cohorts (like “new customers”) can help ensure that early customer pains don’t result in frustration before users have realized much value from your product.
Evaluating customer feedback
In addition to using analytical methods to pinpoint the clients and events that contribute most to churn, surveying and interviewing customers that are at risk of churning or are churning currently can deliver invaluable insights about frustration or confusion that might lead customers to quit using your product.
There are a number of different approaches that companies take to get this information, and no single source should be considered in isolation. A synthesis of these metrics provides the best insight into customer sentiment.
Net promoter score
The net promoter score (NPS) helps you quantify customer perception by asking this question: “How likely are you to recommend our brand to a friend or colleague, using a scale of 1 (not at all likely) to 10 (extremely likely)?”
NPS is popular because it helps identify promoters and detractors of your product. When current users give your product a bad score (and hopefully a comment), that’s an opportunity to contact them and better understand their concerns. Creating a systematic way to organize this feedback to aid feature prioritization will make it most valuable to a product development team.
Net promoter score can also be used as a factor in customer journey analysis or can be correlated to churn likelihood.
Survey churning users as in the cancellation flow
User exit surveys in the churn flow may get a low response rate, but they may also uncover some pearls of wisdom from outgoing users. Be sparing in your questions, and leave feedback open-ended to avoid users just picking the first option from a list to get through this step. Again, the value here is maximized by categorizing feedback so that it is more valuable for analysis.
Churn interviews
If you want deeper insights, you may find success conducting churn interviews with departing customers. This is usually much easier with B2B products but needs to be done carefully to maximize the effect of this qualitative feedback method.
These interviews should be done by someone outside the sales department, such as the product marketing, product management, or customer success, so that customers don’t get the sense that the company is trying to get them to reconsider leaving. If it’s feasible, hiring an outside firm to conduct these interviews can also increase the likelihood that clients give honest feedback about the product.
Best practices to increase retention
After completing your analysis, it’s time to implement programs and processes that reduce friction in using your product:
- Work to drive down a client’s time to value with guides to high-value features. If it takes clients a long time to realize value, this increases the chance that they will churn without ever benefitting from your product. Use in-product guidance to drive users to these features quickly after sign up.
- Bring support to users within your app with self-service documentation. Getting users the help they need during times of frustration should be made as effortless as possible. When customers can access support resources in-app from an embedded knowledge base, information can be shared without interrupting workflows or taking users outside of your product.
- Create product education resources and distribute them regularly among users. This should be a mix of how-to articles, short video tutorials, and regular webinars. Promote these resources in-product to support user journeys.
- Segment users and accounts in a number of different ways. For example, segment them based on signup year, company size, user role, or industry to see if there are higher churn rates among certain groups. If certain segments have higher-than-average churn, ensure that their use cases are being addressed by your product.
Final thoughts about retention analysis
Improving customer and user retention is one of the most critical problems to tackle as a product manager. It is crucial to long-term profitability for SaaS products and provides a number of other benefits.
Analytical evaluation of retention needs to help uncover the reasons why clients churn and what characteristics they are likely to have. Surveys can help flesh out your understanding of the major factors contributing to churn. With this deeper understanding of why customers leave, it’s up to you to test out new strategies with the goal of making them more likely to stick with your product. Good luck!


