

Allison Pickens is VP of Customer Success and Business Operations at Gainsight
Note to Gainsight Customers: This post contains links to Vault Assets you can import directly into Gainsight.
If you’re living in Excel and PowerPoint, then preparing for board meetings takes time. That’s time that you’d probably prefer to spend on actually driving toward the results that the board wants to see.
We’ve created a way to automate the creation of Customer Success board decks. Thanks to some amazing charts created by our Gainsight Admin, Will, the only preparation I do for the board meeting is think about how to (1) voice-over the major takeaways to our board members and (2) answer questions that they’re likely to have.
Preface:
- As is true for all of our blog posts, all data in this post is fake and not indicative of Gainsight’s actual performance.
- Some reports here require the purchase of our Lifetime Revenue Management add-on. In some cases, additional configuration is needed even after LRM is implemented.
- Some of these charts require custom fields in Salesforce and advanced rules in Rules Engine. Check out Gainsight Go for guidance on how to build some of these reports.
Historical Top-Line Financials
-
-
Gross and Net Renewal Rate
-
First, show your historical results. The following chart shows our cumulative gross renewal rate over the course of the quarter, relative to our target, the flat line.
Gross Renewal Rate = 1 – (Churned Dollars + Downsell) / (ARR eligible for renewal in that quarter)
The rate we’re showing below is cumulative — i.e. it shows renewals as they are closed — since over the course of the quarter, we wanted to track our progress relative to our target. The chart also shows our net renewal rate.
Net Renewal Rate = Gross Renewal Rate + (Upsell Dollars) / (ARR eligible for renewal in that quarter)

(Data above is illustrative)
I should be prepared to answer the following likely questions from board members when presenting this slide:
- “That’s great that you achieved your target, but what’s your strategy for exceeding your current gross renewal rate?”
- “I have one portfolio company that’s achieved an X% net renewal rate. How are you going to do that?”
- “Your overall target might be X, but how are you splitting that target across different customer tiers?”
-
Churn Story
As much as we aspire to be the best in Customer Success, we’ll admit to having a churned customer now and then. We’ll want to explain why they churned using their historical scorecard. Our scorecard measures track 8 risk categories and thus show in what way the customer was at risk along the way.
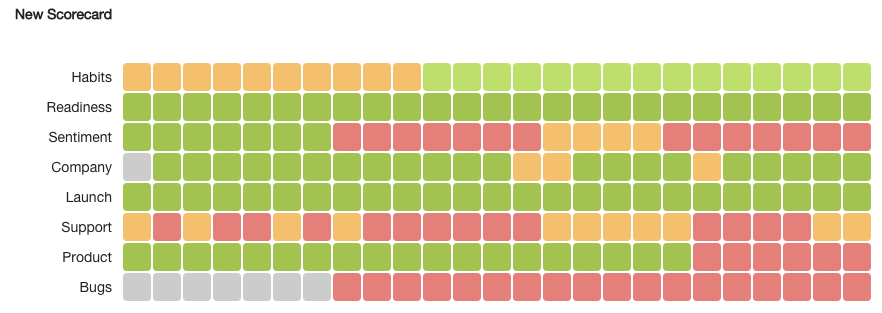
(Data above is illustrative)
I’ll probably get these questions:
- “To what degree was this churn a surprise?” (The answer should be “Not at all,” if we’re using our scorecard measures properly.)
- “How many other customers are in the same situation and thus are at risk of churn?”
- “What are you or other departments doing to prevent churn like this from happening in the future?”
-
Upsell, by Customer Tier
Next, I’ll show where our upsell is coming from. The following chart shows the distribution of upsell across our 3 customer tiers. It also shows to what degree upsell is being driven by our Renewals and Expansion team and by our Sales team (which drives upsell in Strategic accounts). Learn more about how we’ve divided ownership of upsell here.
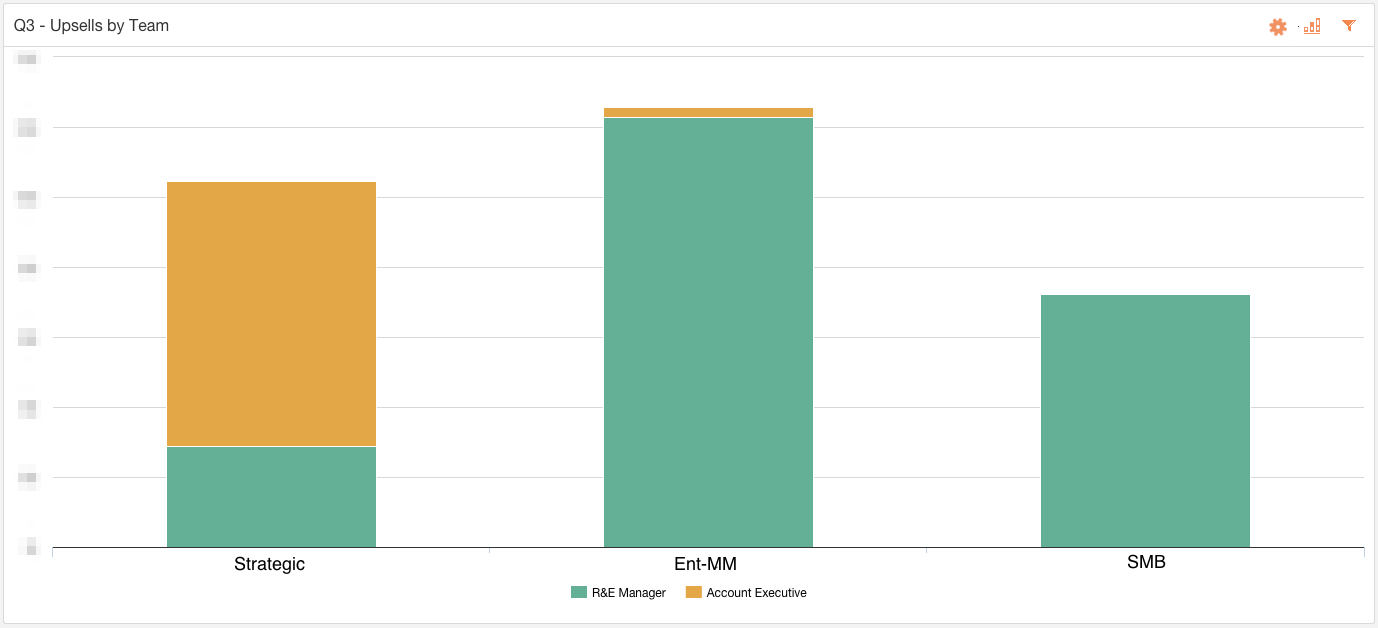
(Data above is illustrative)
This chart shows the size of upsell in the 3 different tiers. Our Strategic customers are likely to show larger expansion; our SMB customers are likely to have a long tail of small upsells.
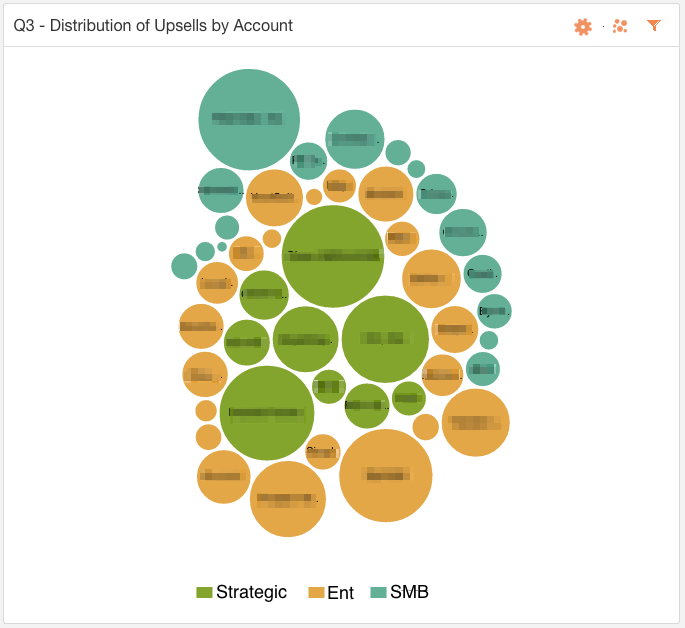
(Data above is illustrative)
Questions may include:
- “What are the use cases for these upsells?”
- Examples could include sales of more licenses into the core team (driven by organic growth of that team), expansion into a new division or region, sales of licenses into other departments (driven by cross-functional collaboration), sales of Premier Support/Success, add-on’s, etc.We’re actually working on creating charts in Gainsight that show this level of detail. It’s also a good idea to prepare a few anecdotes about recent upsells.
- “To what degree has each Renewals & Expansion manager met his/her upsell quota?”
- We’ll also work on a chart showing this as our R&E team grows.
Future Top-Line Financials
-
Renewals Eligible This Quarter
Looking to the future, I’ll show the ARR for upcoming renewals…
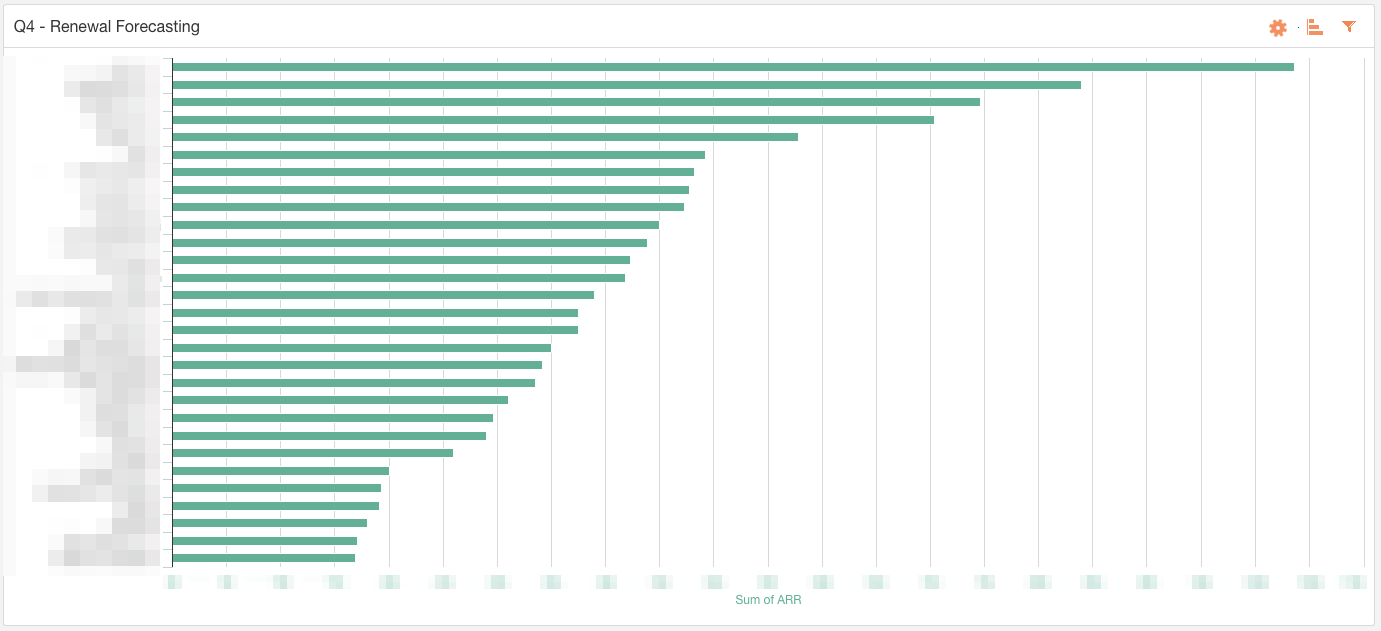
(Data above is illustrative)
…and also the scorecard measures for each of those companies, to show any risk in those renewals.
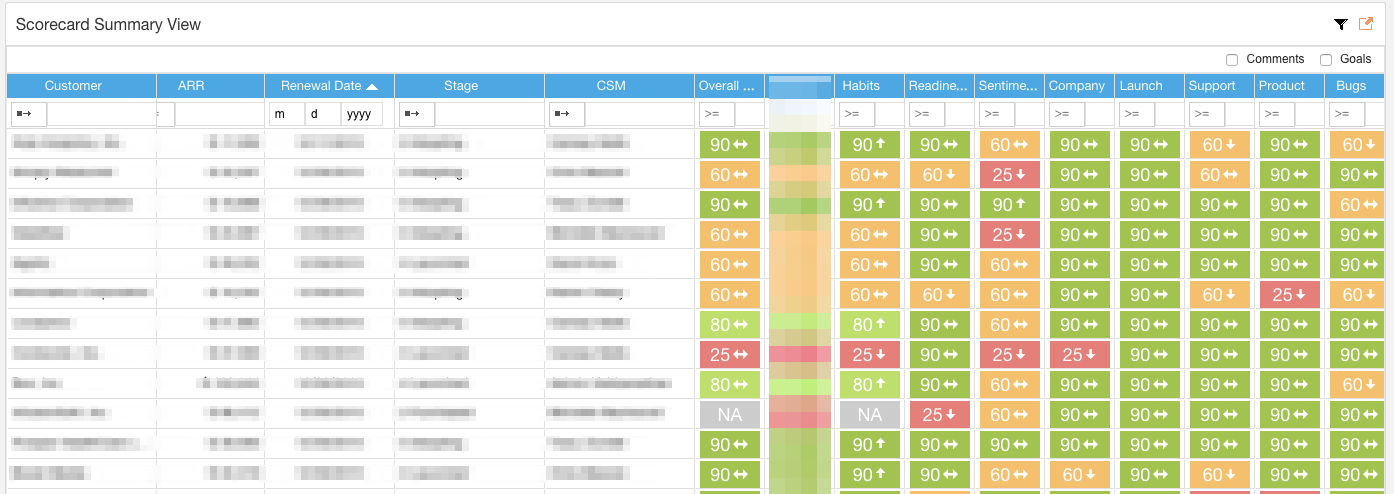
(Data above is illustrative)
I’ll prepare to answer these questions:
- “What is your Gross Renewal Rate forecast?” I’ll give a conservative estimate that I’m “committing to” as well as a stretch goal showing “what’s possible”.
- “For those customers that are less likely to renew, what is the reason?”
The scorecard chart described above is useful for answering this question, since if any of the 8 scorecard measures is red, the renewal may be at risk.
-
Upsell Pipeline
I’ll provide an upsell forecast based on our current pipeline. As you get more sophisticated, you’ll want your Renewals & Expansion Manager to assign a probability to each upsell so that you can take a weighted average of the pipeline to arrive at closed sales.
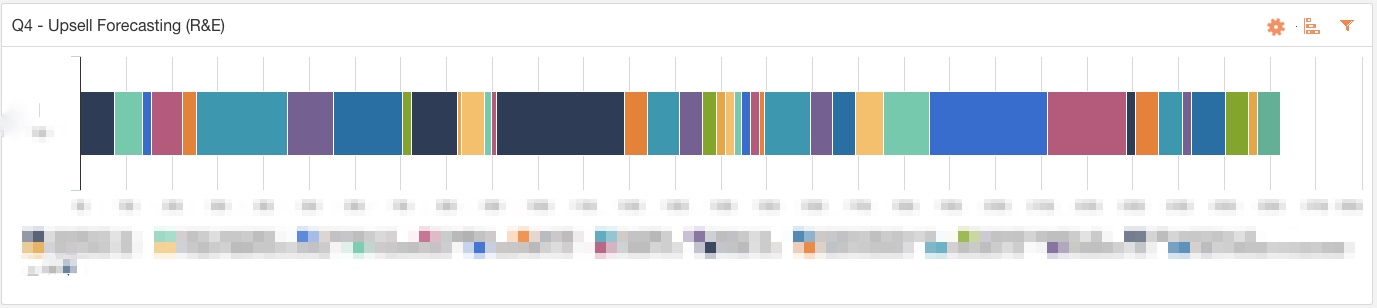
(Data above is illustrative)
Likely questions:
- “Are the use cases for your forecasted upsell the same as those driving historical upsell?”
Cost Metrics
-
ARR and Accounts per CSM
I’ll show ARR per CSM…
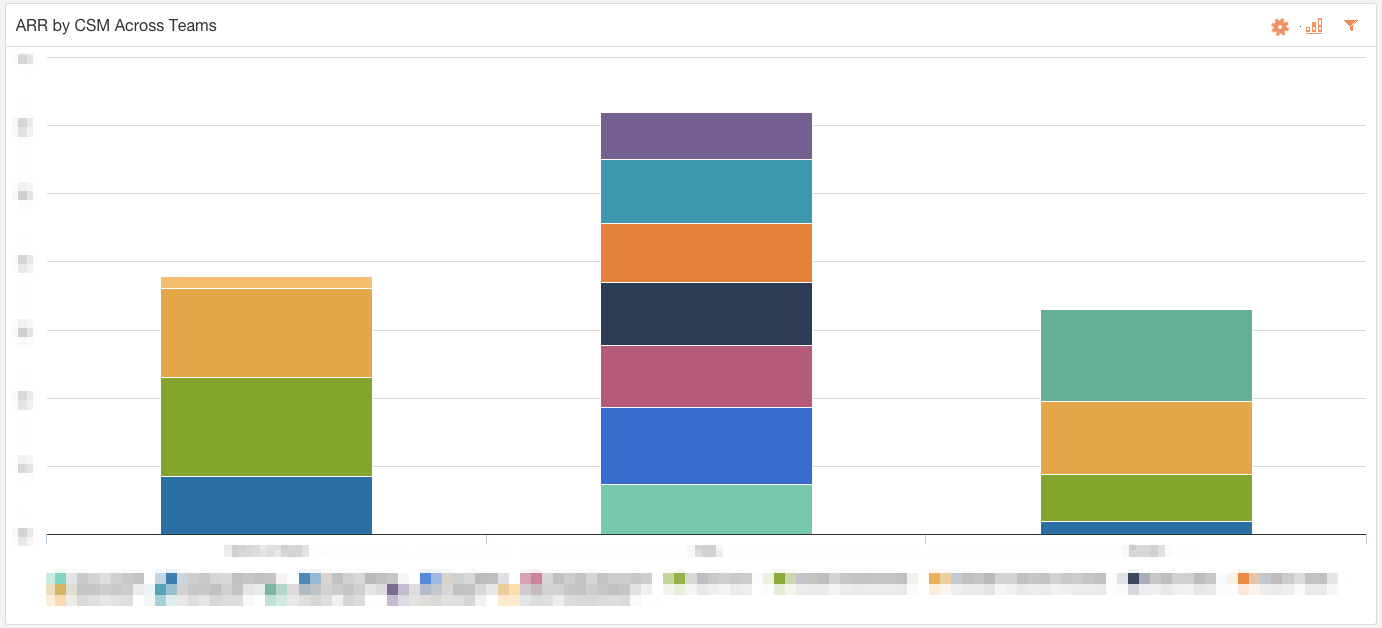
(Data above is illustrative)
…and number of accounts per CSM, which, of course, is one of the drivers of ARR per CSM.
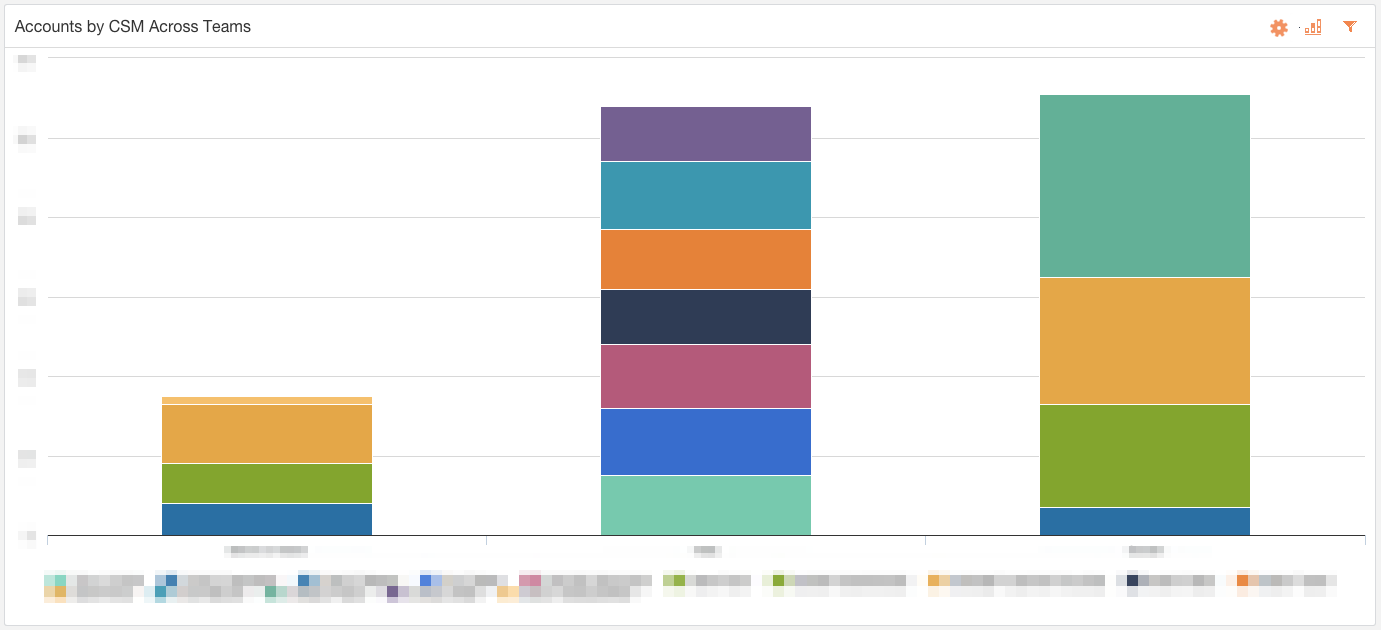
(Data above is illustrative)
Likely questions:
- “Is ARR per CSM improving?”
- “What’s your fully loaded cost of CSM per dollar of ARR managed?” This should be less than 15 cents per dollar, as I described in my prior post on building your CSM financial model.
- “What’s your plan for meeting the 15-cents-per-dollar target?” Your plan will likely involve a combination of increasing accounts per CSM, driving ARR per account (e.g. through upsell), or reducing cost per CSM (e.g. by hiring in less expensive locations or hiring more junior team members).Your plan is likely to vary by customer tier, as described in more detail in my prior post on segmentation.
Trends in Operating Metrics
-
Habits Scorecard
So you’ve hit your gross renewal target. But what’s driving your success? You’ll want to show how you’re improving your Habits Scorecard Measure, which measures to what degree your customers are deriving value from your product. As explained in prior posts on our Habits Targets and our Success Plan Process, our CSM team aspires to foster a form of adoption that we believe signals that the customer is getting value.
The chart below shows our customers distributed across 4 different levels of Habits, each week of the quarter. We want to show that customers are moving into the green and blue sections.
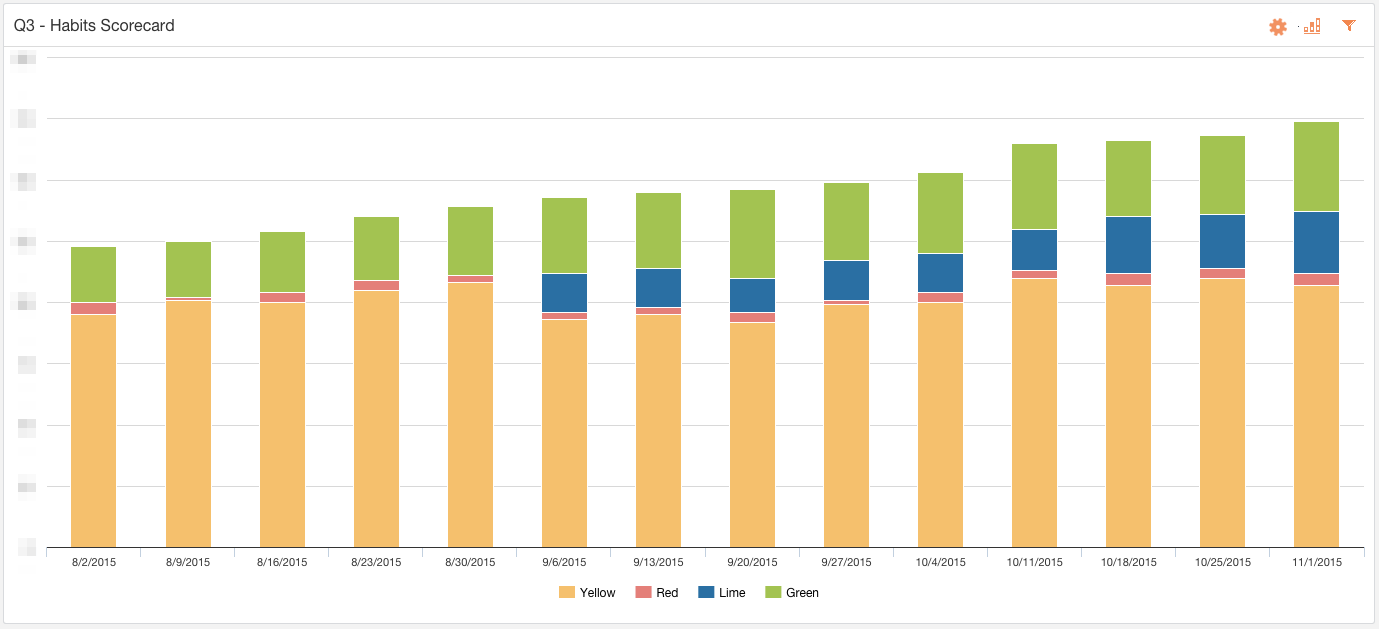
(Data above is illustrative)
The following chart shows how Habits are improving at the user-level (vs. the customer-level, above), by illustrating the growth in Healthy-Level Users (daily active users of our Cockpit functionality) and Daily Active Users over time.
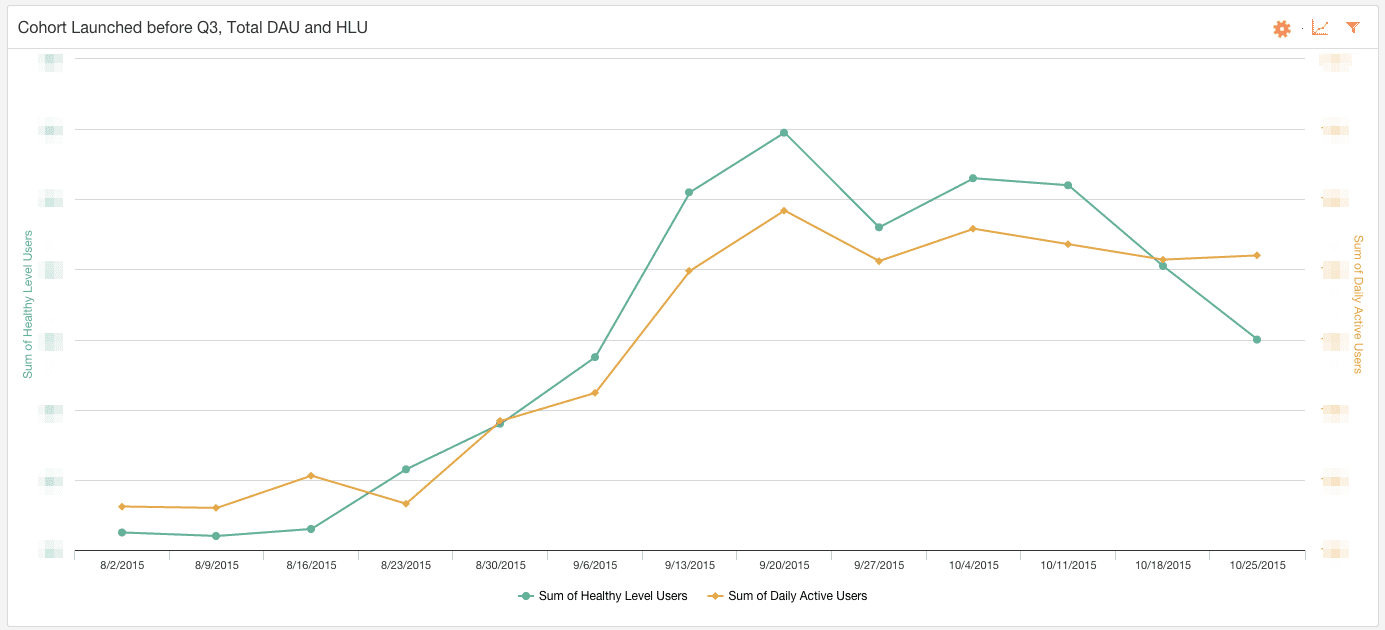
(Data above is illustrative)
Likely questions:
- “How did you arrive at the definitions of each of the 4 levels of Habits?”
- “What is your process for moving customers into the top levels?” We follow our Success Plan Process and have also come up with a long list of “Habits Techniques” that help customers adopt the product more fully. (You can incorporate such techniques into a Playbook in Gainsight.)
- “What caused each of the ups and downs in the chart on daily active users?”
-
Top Drivers
You’ll want to show a few charts showing what’s driving your Habits scores.
Those include:
-
- Top Customers, by Page Views and Unique Users:
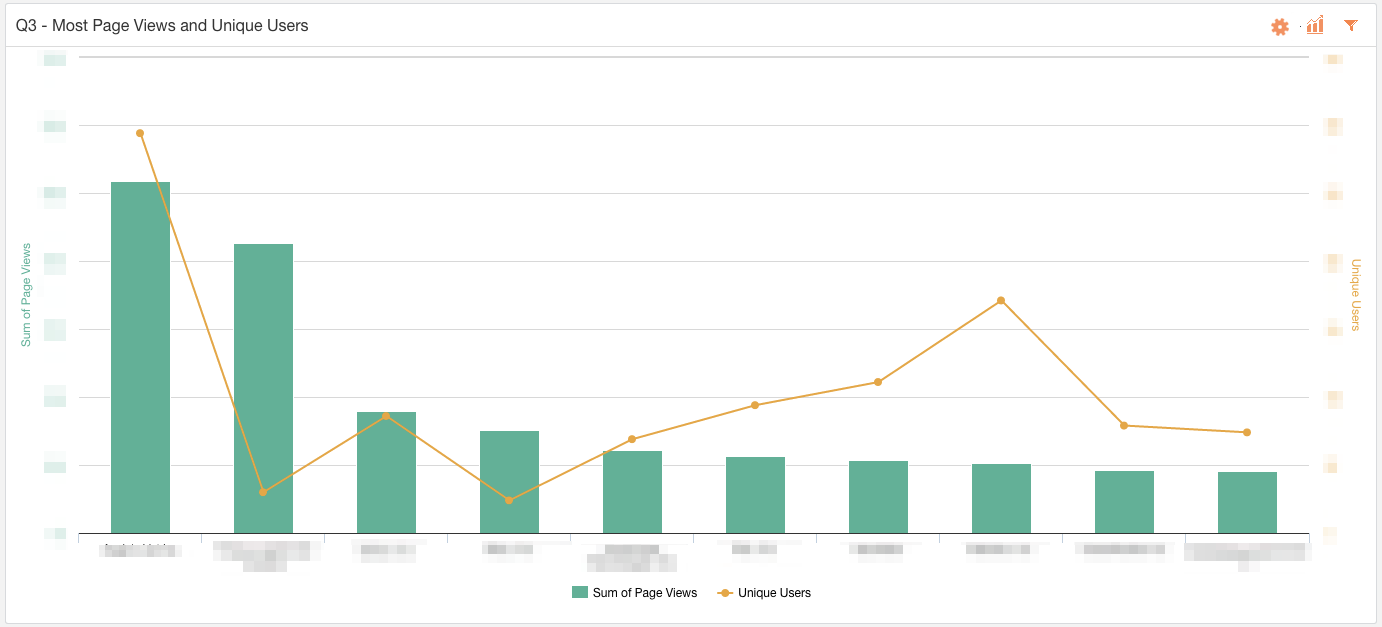
(Data above is illustrative)
- Top Features:
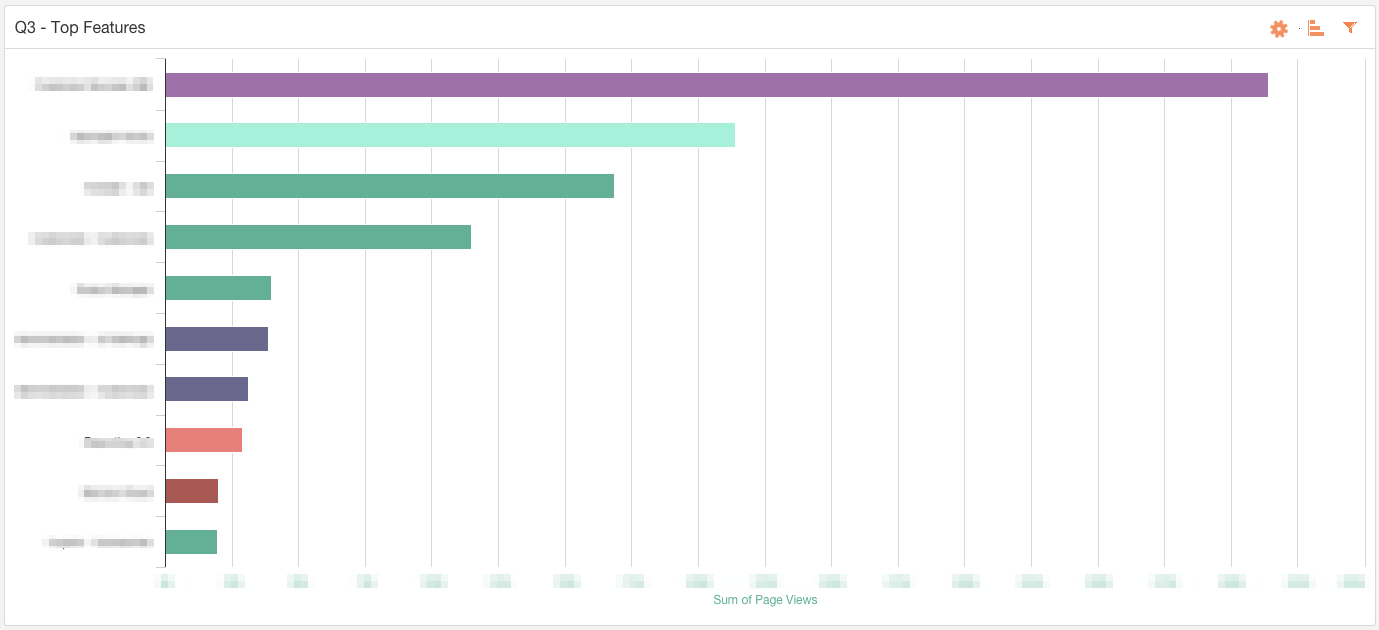
(Data above is illustrative)
Be prepared to answer questions such as:
- “What are you doing to make sure your top customers stay happy?”
- “What are you doing to drive adoption of Feature X?”
-
NPS
Show your NPS score over time. For example, this chart shows the trend in average NPS score (green), grouped by the original contract date.
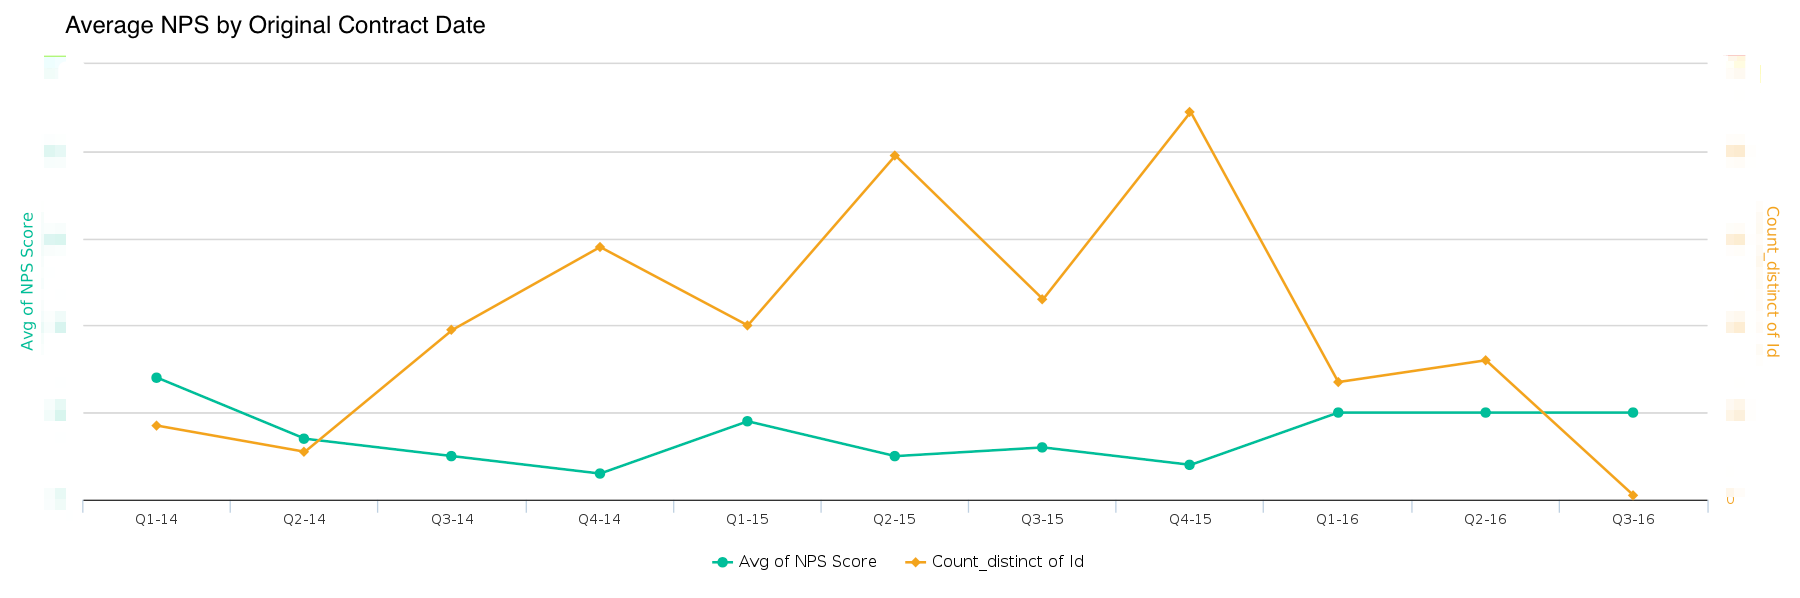
(Data above is illustrative)
Likely questions:
- “What’s your NPS goal, and why?”
- “What are the most common reasons for a Promoter rating? Detractor rating?”
- “Would it be easier to increase your NPS by converting Passives into Promoters, or by reducing the number of Detractors?”
-
Risks
I talk about the most common risks in our customer relationships in order to (1) highlight potential causes of future churn and (2) illustrate what we need to do to make our customer relationships healthier.
The following chart shows the distribution of Flagged Risk CTAs across categories over time. If the chart below showed real data, then I might conclude that we should hire more people on our Support team to improve time-to-resolution, and that we need to amplify our efforts to align with executives at our customers (given the frequency of Company Risk).
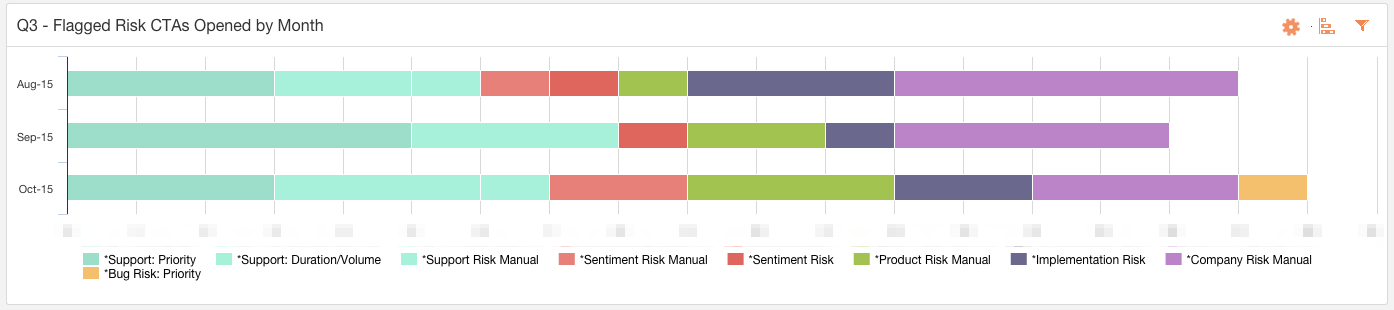
(Data above is illustrative)
Questions are likely to include “Why is risk X so frequent?” and “What are you doing to tackle it?”
___
If you’d like to learn more about how to prepare for your upcoming board meeting using Gainsight, contact your Gainsight CSM. To learn about additional processes you can set up for your CSM team and other departments, visit our Business Processes page on our Support website.
You can also send questions or feedback to Allison at apickens@gainsight.com. Follow her blog posts on Twitter at @PickensAllison.
Vault Assets mentioned in this post
(for Gainsight customers only)
Here are ready-to-use versions of what you’ve seen in this post:
