No matter how confident we all are as business leaders, if you’re like me, you constantly wonder if you’re on the right track compared to your peers. Unfortunately most of us don’t have a mirror on the wall to tell us how great we are.
In Customer Success, in particular, one of the most common questions we get at Gainsight is “how does my [churn rate / CSM cost model / net retention / etc.] compare to others?”
The investment bank Pacific Crest publishes each year the most comprehensive study of SaaS metrics so companies can see how they stack up on metrics like growth rate, customer acquisition cost and other factors.
And in each successive year, I’ve been impressed by the increasing granularity of metrics in the survey around issues relevant to Customer Success.
This year, we partnered with Pacific Crest to deliver an analysis of the 2015 report, as related to Customer Success. Our takeaways are based upon a review of the 305 responses from senior executives at SaaS companies. Some more data on the panel surveyed:
- $4MM median revenues, with 133 companies >$5MM and 57 >$25MM
- 47 median full-time employees (range of 2 to 1,200)
- Median customer count of approximately 300; 28% of respondents have >1,000 customers
- 70% of participants headquartered in the U.S.
- $21K median annual contract value (ACV), with 21% of participants below $5K and 17% above
- $100K. Good mix of field sales (41% use as predominant mode), inside sales (21%), as well as
- Internet, channel, and mixed modes
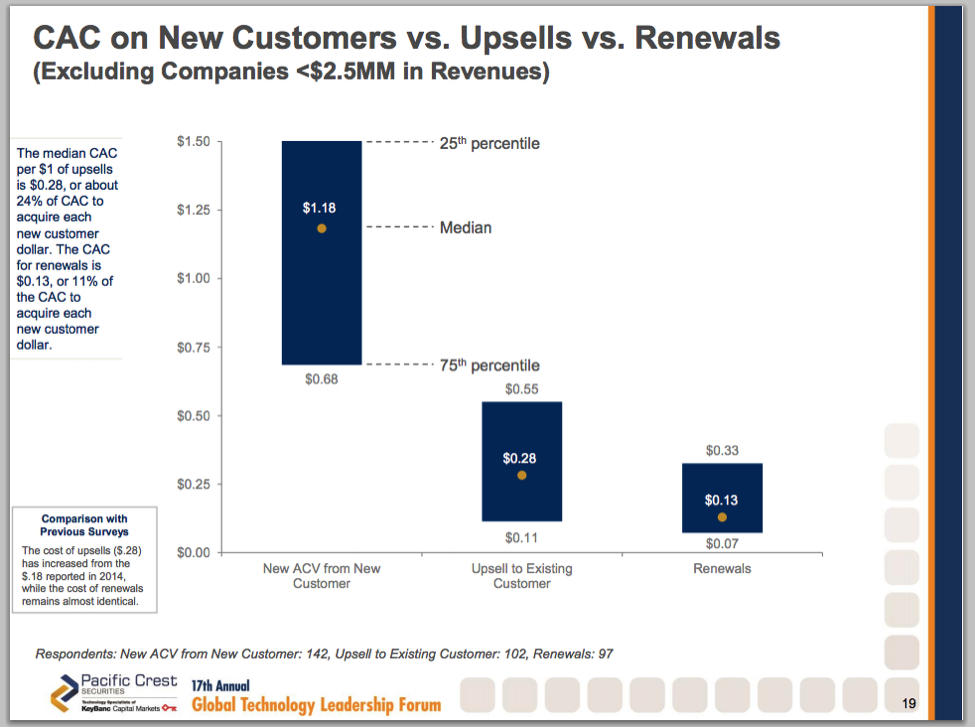
Takeaway 1: Median Spend On Renewals Is $0.13 on the $1
Some companies categorize part or all of Customer Success in Cost of Good Sold (if related to reactive customer support or ongoing service). But most companies either have part of the CSM cost allocated to sales and marketing or have a separate renewal sales team. In either case, the median total cost of renewals (as a fraction of $1 of Annual Recurring Revenue) is $0.13.
To make this practical, think of an individual CSM or Account Manager. If we assume all of that person’s cost is in sales and marketing to secure the renewal, we can do the following analysis:
- On-target Earning: Let’s say the OTE for the CSM is $120,000.
- Load: Let’s assume that the overhead including benefits and the management chain adds another 30%, bringing the total loaded cost to $160,000.
- ARR Managed: If you assume 1 year contracts, this hypothetical CSM needs to manage $160,000 / 13% = $1,230,769 in ARR. If contracts averaged 2 years, that might mean the CSM manages double that amount.
- ASP: If we assume an annual spend of $50,000 per year per customer, that means the CSM with 1-year contracts has to manage ~25 customers.
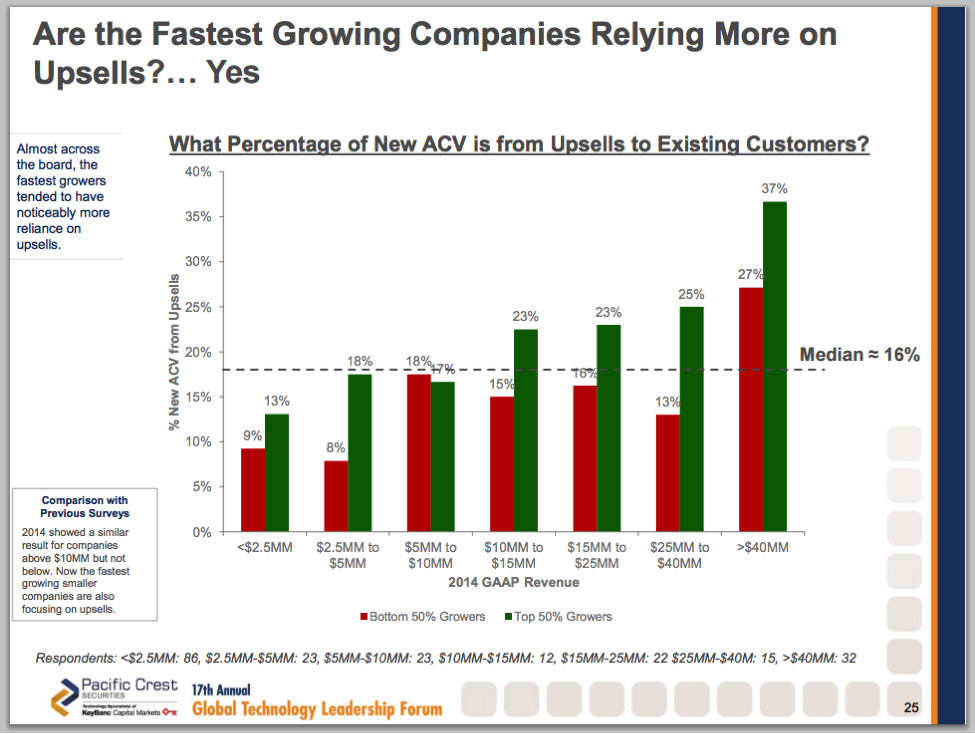
Takeaway 2: Faster-growing Companies Benefit from Up-sell
In the survey, companies that were growing faster reported a higher percentage of new sales from existing customers.
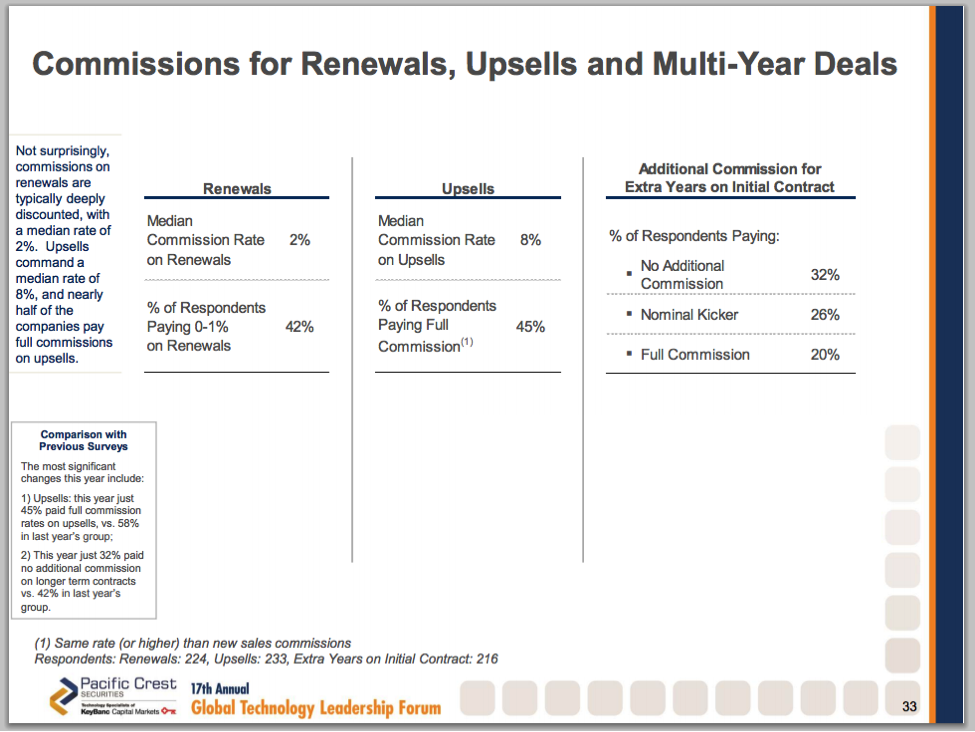
Takeaway 3: Median Commission Rate On Renewals Is 2%
This is pretty self-explanatory but the expectation is renewals are easier than new sales so a renewal rep, account manager or CSM should have a lower rate. By comparison, the median commission rate for new sales was 9%.
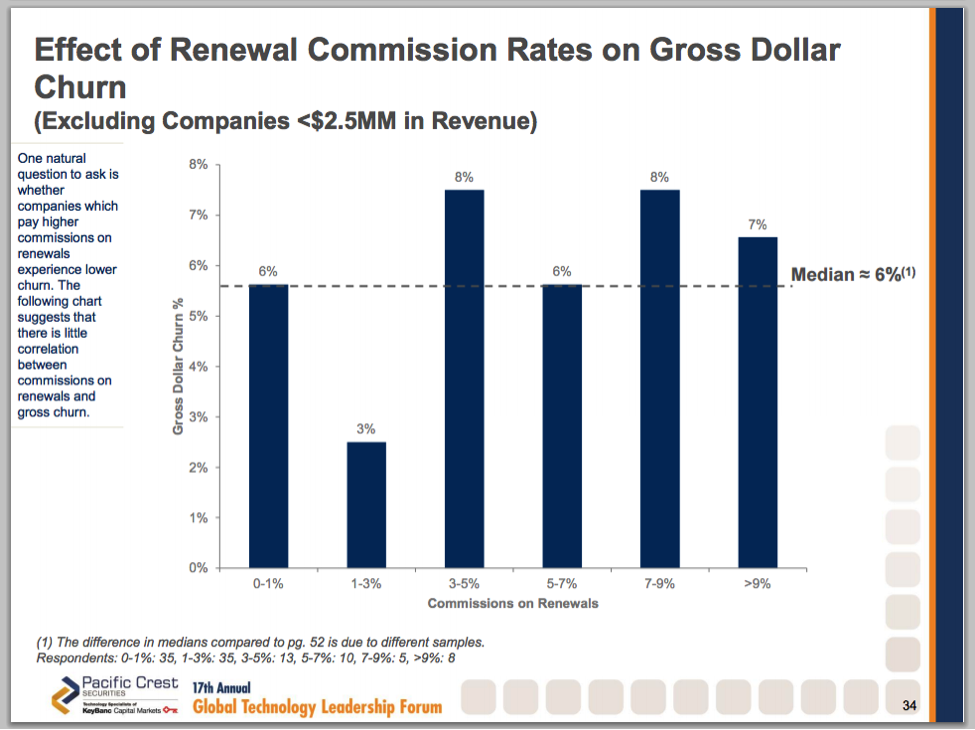
Takeaway 4: Companies With Higher Renewal Commission Don’t Have Lower Churn
Pacific Crest investigated whether paying more for renewals will drive higher renewal rates. The data doesn’t support that.
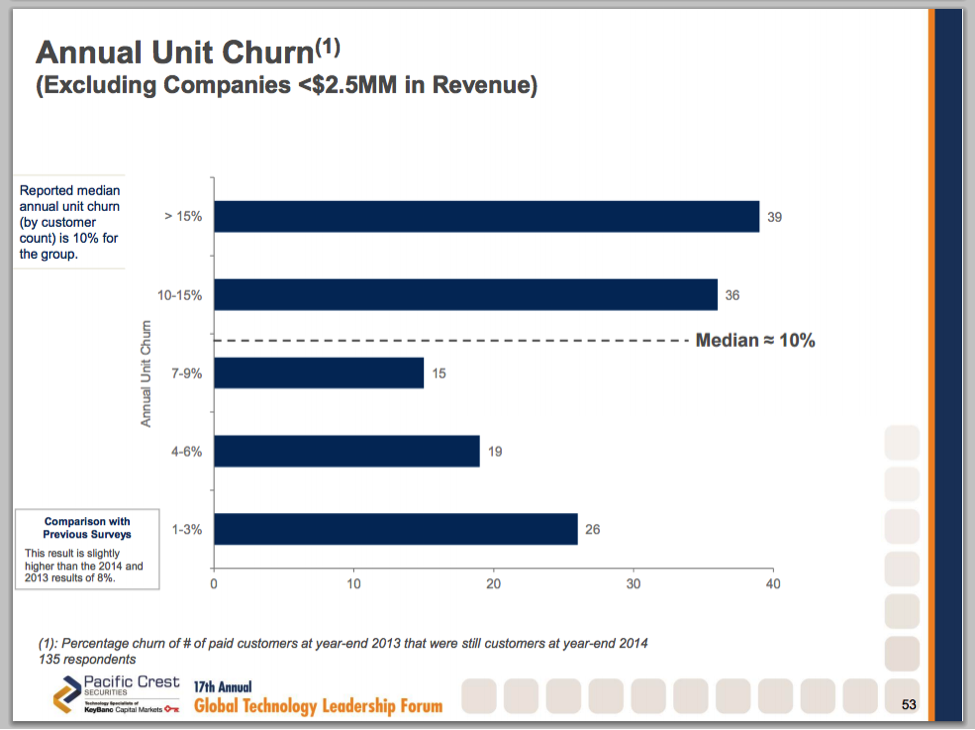
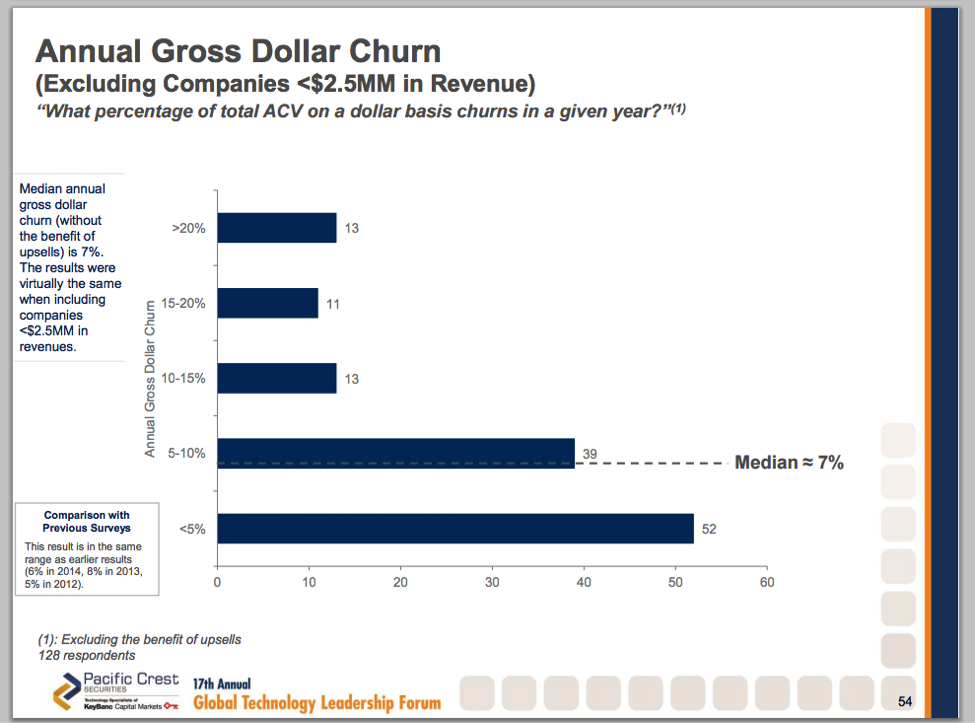
Takeaway 5: Median Logo Churn Was 10% and Dollar Churn Was 7% (Though Not Super-meaningful)
We caution readers to not read too much into this. Some industries and segments have naturally high churn (e.g., marketing software for SMBs) while some have naturally low churn (e.g., enterprise financial software). So the median is likely a mix of apples and oranges.
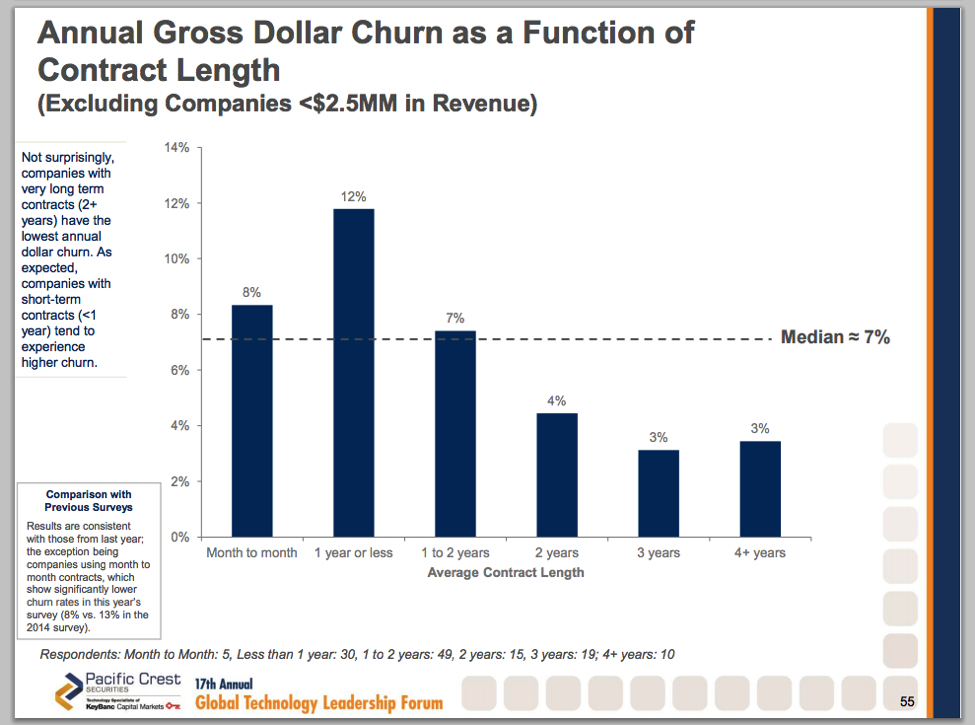
Takeaway 6: Month-to-month Contracts Don’t Have Higher Churn, On Average, Than Annual Contracts
Many assume that month-to-month businesses will have the highest rate of churn. The survey responses indicated otherwise.
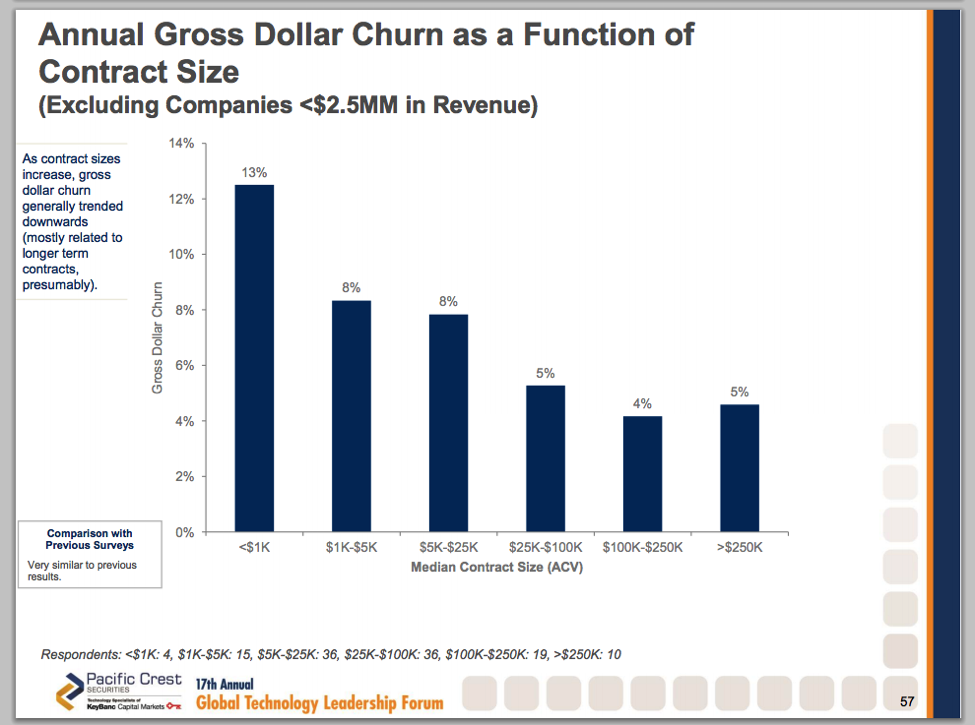
Takeaway 7: Gross Churn Varies Significantly By Contract Size
More interestingly, the survey responses give us median churn by contract size. This is relevant for benchmarking purposes.
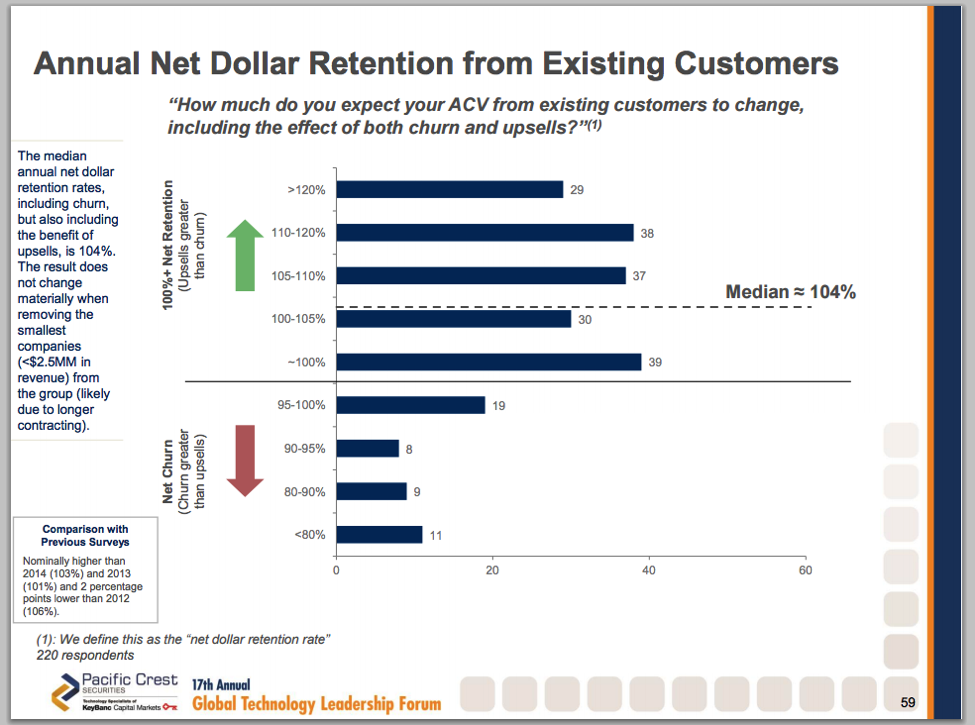
Takeaway 8: If Your Net Retention Is < 100%, You Are Below Median
No matter what segment you sell into, it’s clear that 100% net retention is the bar to exceed, with the median at 104%.
Conclusion
As with any survey, the data above is a mix of apples, oranges and pears. But the number of Customer Success data points in this most recent survey shows how top of mind Customer Success is for SaaS CEOs. And needless to say, all of them are wondering “who’s churn rate is the fairest of them all?”