
Four key digital experience analytics to boost conversions and sales
Digital experience now plays a key role in defining a brand’s image in our increasingly online world. With the uncertain economy of 2023, companies are working hard to make the most of their existing resources. At the same time, they’re dealing with a growing number of competitors due to the widespread adoption of AI technology. There’s a clear need for businesses to deeply understand how users engage with their digital products.
Digital experience analytics provide in-depth insights into your customer’s experience with digital products such as web pages, mobile apps, or desktop products. By quantifying user experience and evaluating digital behaviors, you can systematically identify and address friction points and sources of user frustration. You can broadly categorize analytics into product interactions (core web vitals), user behavior (user journey mapping), sentiment (in-app feedback), and conversions (on a form).
This article covers the crucial concepts and techniques of digital experience analytics.
Digital experience analytics summarized
| Priority | Metric Class | Summary | Example |
|---|---|---|---|
| 1 | Core Product Vitals | This class of metrics measures the technical performance of a digital product. These measures give product teams insight into where the experience lags or crashes most often. | Page load time, error rates, network metrics, caching performance |
| 2 | Behavior Analytics | This dives into understanding how business users interact with your product, their usage patterns, and how effectively they navigate through features. | Analyzing user flows for feature adoption, tracking event sequences for complex tasks, studying frequency, adoption rate and duration of sessions |
| 3 | Sentiment Analytics | Sentiment can be measured through product surveys, spanning NPS, CES, or deeper multi-question surveys | Adoption rate, in product customer feedback, NPS, CES, Rating surveys, |
Core product vitals
Before delving into the nuances of the user’s digital experience, we must acknowledge the foundational role played by your system’s core performance. Consider it as the bedrock of the user experience – if the base isn’t solid, all other efforts to enhance the user’s journey may be futile. Core Product Vitals, encompassing aspects like platform stability, page load times, and error rates, essentially define this base level. They represent the primary building blocks, ensuring that your digital product functions reliably, thereby enabling a seamless interaction for the users.
Why it is important
Slow page loads, unresponsive interfaces, and unexpected errors are all correlated with higher bounce rates, fewer page views, and lower engagement with your product. Allowing these metrics to slip can result frustrated users, low app store ratings, and reduced revenue. For example, according to research, 47% of users expect to load in 2 seconds or less. Each additional second of load time, increases the likelihood of the user abandoning the page. With many other products competing for your users’ time and money, a slow and error-filled experience is unlikely to be tolerated for long before users leave for a competitor’s alternative. This means that while addressing digital product performance may not necessarily attract new users, it has a clear link to retaining existing users.
What you can track
There are a number of factors you can track to assess your product’s vitals:
- Errors (Javascript, HTTP, etc)
- Time to… title, interaction, & start render
- Broken and misdirecting links
- Network metrics like latency and RTT
- Cache performance
How you can measure your metrics
Before addressing user behaviors, sentiment and form completion, product teams should ensure that core performance meets industry standards. Doing this work up-front and consistently monitoring to make sure that issues don’t creep in over time will help all the other experience metrics in the long-term.
If you haven’t implemented a way to gather detailed performance analytics yet, this should be a top product priority. The sooner your team is aware of page performance issues, the sooner they can address fundamental user digital experience issues such as errors and load times.
Behavior analytics
After addressing the core vitals of your product, teams concerned with improving users’ digital experiences would do well to instrument means of measuring and analyzing user behaviors.
Why it is important
The reason to prioritize behavior analytics when developing your digital experience is that user behavior in your product will tell you much more than any survey or user interviews can. By aggregating behaviors across your user base, you get a much clearer picture of what matters to them and what frustrates them about your product.
What you can track
The particular behaviors a product team chooses to track and assess are contingent upon the behaviors they aim to stimulate or mitigate. In the context of B2B products, the focus might shift towards specific interactions tailored to professional use-cases. For instance, a project management tool might pay close attention to behaviors indicating effective collaboration, like task assignment or completion rates. On the other hand, a B2B software platform might track user engagement with its various modules, focusing on metrics such as frequency of usage or the amount of data processed. Ultimately, the behaviors tracked should align with the product’s intended business utility and the value it aims to deliver.
In addition to specific product behaviors, there are several digital experience behaviors that can indicate either user engagement or frustration. Here are a few behaviors that could signal user frustration in a B2B context:
- Frequent navigation away from an expected workflow, which might suggest friction in the process.
- Regular use of the ‘back’ button, indicating users are reaching sections they didn’t intend to.
- Limited clicks on executing the final steps of a flow, hinting at hurdles in completing tasks.
On the flip side, behaviors demonstrating user engagement might include the following:
- Prolonged session durations, suggesting deeper exploration or productive work within the product.
- Increased document uploads, showing active usage and reliance on your platform.
- Addition of more users, indicating adoption across teams or departments.
However, remember that not all interactions are created equal – a longer session on a complex analytics page could be seen as engagement, while on a login page, it might signal difficulty. Context is key in digital experience analytics. The metrics should align with the specific functions and expected use cases of your product, offering insights that are relevant to your unique set of users.
How you can measure your metrics
There are a variety of techniques that product delivery teams can use to evaluate user behaviors:
- Path analysis through a tool such as Path Analyzer
- Funnel analysis where users are tracked through a designated workflow to see where they drop off
- Engagement metrics, such as click through rates or CTA clicks on in-product guides
- Feature adoption metrics, tracking how users are adopting each feature or module in your product
- Heat map review (for clicks, scrolling, and attention) to understand where the most interesting parts of a page.
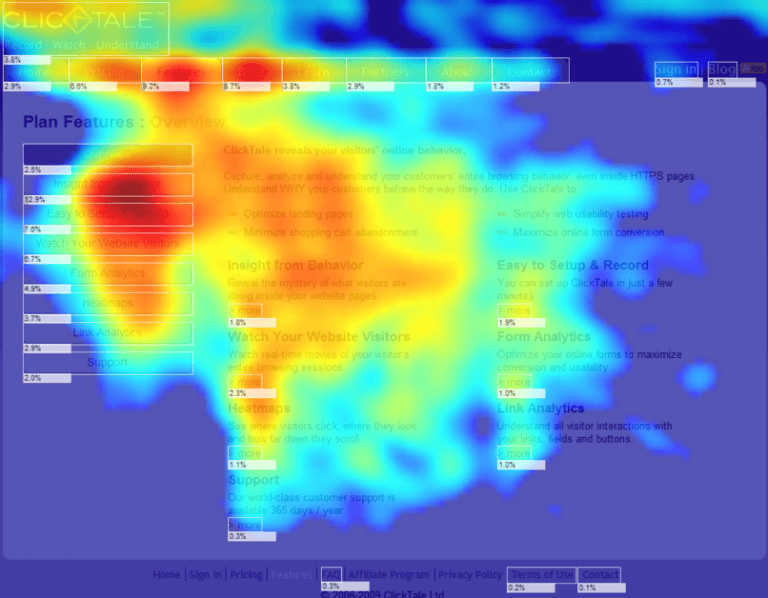
Heatmap (source)
Sentiment analytics
Once your team has set up tracking for both product vitals and user behavior, the next digital experience analytics priority is sentiment analysis.
Why it is important
Analyzing user sentiment helps product teams fill in the gaps in their digital experience. You get direct input from your users on functionality that they would like to see added to your product. It help you identify value-driving features or bugs that your development team should prioritize.
While the other facets of digital experience analytics offer valuable information about ‘what’ actions users are taking with your product, they might not fully convey the ‘why’ behind these behaviors. This is where sentiment analytics comes into play. By capturing users’ feelings and attitudes towards your product, sentiment analytics provides the much-needed context to interpret user behaviors, thus helping you uncover the motivations and reasons driving the observed interactions.
What you can track
One may be tempted to equate adoption rates with user sentiment, assuming that if users dislike a product or feature, they are unlikely to use it. However, it’s essential to recognize that lower adoption rates can stem from various factors unrelated to sentiment, such as navigation difficulties or functional issues.
To truly understand user sentiment, one needs to delve deeper. Metrics such as customer satisfaction score (CSAT), feature-specific feedback, user reviews, and customer complaints are often more revealing. They provide insights into user attitudes and feelings towards your product, helping you capture the ‘why’ behind their behaviors, even if they are mandated to use certain aspects of your product due to industry requirements or customer segments served.
How you can measure your metrics
According to Qualtrics, “Response rates increase when you ask for feedback immediately after the goods/services are delivered. Immediate feedback is also 40% more accurate than feedback collected just 24 hours later.” .
Asking for feedback directly in-product, such as through surveys deployed via tools like Gainsight PX, allow you to set up these feedback opportunities at point of service and get better response rates (up to a 3700% increase in response rate compared to via email) as well as more accurate responses as a result.
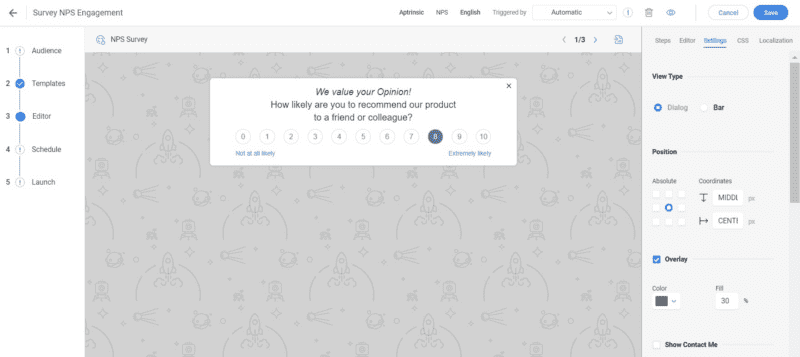
Gainsight template design editor for creating an in-app NPS survey (source)

Customer onboarding, in-app engagement, and analytics

Product adoption with integrated digital events, emails, and surveys

Customer expansion with self-service knowledge base and community
Conclusion
The importance of digital experience analytics has grown significantly in the past several years. Fortunately, there are a number of sophisticated tools that you can easily implement to assess your users’ digital experience. With these tools in place, measuring core product vitals, digital behaviors, user sentiment, and friction on forms enables your product team to prioritize the features and user flows that have the biggest influence on your digital product experience.