
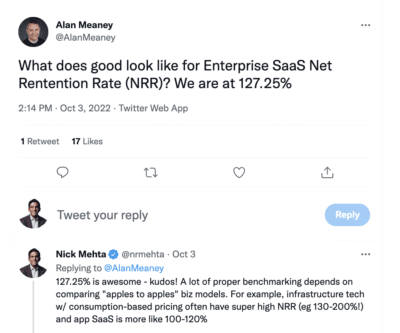
I get an email almost every day from other CEOs or CXOs that goes something like this:
“What’s a good metric for… [Growth Rate / Net Revenue Retention / Gross Margin / ARR / Employee]?”
Often the message provides no context on the leader’s business. They just want to know what “good” is.
As a CEO who has seen Gainsight grow from a very small company to nearly 1500 employees, I completely understand that instinct. Benchmarking fulfills a basic desire for any competitive person—“how am I doing and where can I get better?”
As an example…
Thanks to the internet, it’s become comparatively easy to get benchmarking data:
- Most investors offer this data to their portfolio companies.
- Investment banks like KBCM publish aggregate studies.
- Benchmarking websites are abundant now, including the fabulous SaaS analytics tool at venture firm Meritech Capital’s website.
Though to quote Spider-Man, “with great power comes great responsibility.” The onus is on CEOs and leaders to place benchmarking in their business’s unique context. In other words, it’s important to compare apples to apples.
Here are five examples to consider:
1. Different SaaS Pricing/Business Models Cause Net Dollar Retention to Vary a Lot
If you follow me, you know that I’m a huge fan of the importance of Net Dollar Retention (sometimes called Net Revenue Retention or simply Net Retention). Using the Meritech benchmarking site, you can see the wide range of values for public companies around NDR:
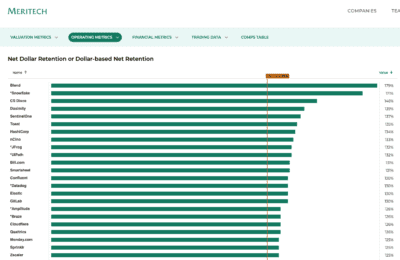
So it’s easy to calculate an average NDR for SaaS companies—but it’s also meaningless. Inside that list of firms lies a variety of commercial models. Companies with usage-based or consumption pricing—like Snowflake and Toast—will naturally have higher NDR. Similarly, companies that sell into IT infrastructure (e.g. Confluent, HashiCorp) will have higher NDR than their application software peers. That doesn’t mean that SaaS application companies are worse off than the IT infrastructure companies, they just have a different business model.
Takeaway: When looking at NDR, make sure to include benchmarks for similar business models and product types.
2. Different Infrastructure Cost Models Cause Gross Margins to Vary a Lot
Anyone with business experience knows the importance of Gross Margins. Gross Margins are the biggest lever in most companies in terms of long-term leverage and cash flow.
And if you look at the Meritech benchmarks, you’ll see Gross Margins from SaaS companies can vary from 18% (Toast) to 90% (Asana):
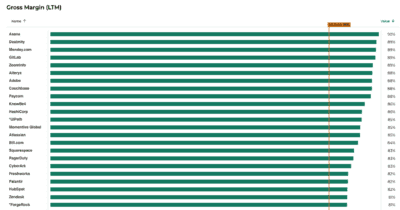
Gross Margins (and the Cost of Goods Sold that fuel them) can vary greatly depending on the business’s infrastructure costs. Gitlab’s software largely runs in customer environments, so its hosting costs are lower. By comparison, Five9 has 58% Gross Margins, given their embedded telephony costs.
Takeaway: When reviewing Gross Margins, make sure to compare yourself against companies with similar infrastructure models.
3. Different Go-to-Market Models Cause Payback Period to Vary a Lot
Another hot metric for SaaS valuations is Customer Acquisition Cost. The efficiency of a SaaS company’s Sales and Marketing has a big impact on long-term profitability. One measurement of Customer Acquisition Cost is “Payback Period”—how long does it take to get the money for Customer Acquisition back?
Per Meritech, Payback Periods for public companies vary between 6.8 months (Akamai) and 82.9 months (Adobe):
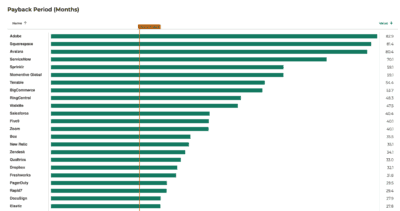
By definition, companies with Product-led Growth models tend to have shorter Payback Periods—with examples including Datadog (7.4 months) and Digital Ocean (11.0 months). By comparison, businesses with enterprise sales models will naturally have longer periods, e.g., ServiceNow (70.1 months) or Salesforce (40.4 months).
In parallel, many of these businesses with expensive Customer Acquisition also have long Customer Lifetime Value in the form of high Net Dollar Retention. While it costs ServiceNow and Salesforce a great deal to bring on a new client, those customers are very valuable over time.
Takeaway: When analyzing your Payback Period versus benchmarks, make sure to normalize for companies with similar Customer Lifetime Values.
4. Different Talent Models Can Cause ARR/FTE to Vary A Great Deal
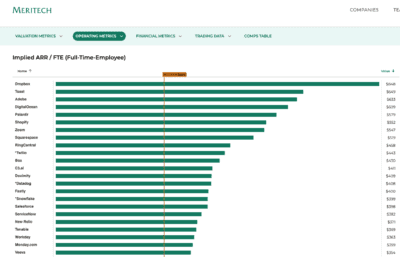
Annual Recurring Revenue per Full-time Employee (ARR per FTE) is a useful metric to understand the potential profitability of a company, since so much of a software company’s costs come in the form of labor. The range can extend from $92K (Freshworks—outside the scope of the above screenshot) to $848K (Dropbox) per employee.
On paper, this would make it appear that Dropbox will be fundamentally more profitable than Freshworks. Yet, this calculation misses the nuance that not all employees cost the same amount. Freshworks has a largely India-based workforce, while Dropbox still has a big contingent in the much-more-expensive San Francisco Bay Area.
Takeaway: For ARR per FTE benchmarks, normalize for geography.
5. Rule of 40/50 Is a Great Normalizer
While the input metrics can vary greatly from company to company, ultimately all businesses are measured on their ability to generate long-term cash flow. One of the best proxies for the potential of a SaaS company to create substantial profit over time is the “Rule of 40/50” calculator, which is simply the delta between company growth rate and EBITDA margin. As you can see from the Meritech site, the Rule of 40/50 currently shows a strong correlation to enterprise multiple.
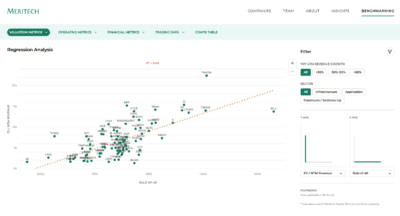
Even within this benchmark universe, be careful to compare yourself to an achievable peer group. Bill.com’s unworldly Ro40 of 152% largely is the result of its payments business model. As you can see, there is a strong clustering of companies in the 20 to 60 range.
Takeaway: Other benchmarks are great as long as you normalize for the peer group; long-term profit metrics like Rule of 40 are the ultimate benchmark.
Conclusion: Normalize and Contextualize
As an industry that has grown exponentially in the past decade, we’ve relied heavily on benchmarking to communicate success (and areas of improvement). And despite how helpful those standardized metrics are, they can be misleading if we don’t take the time to normalize and contextualize those numbers. Success can be blown out of proportion, and extraordinary achievements can be undersold. And the “wrong” data-driven decisions can be made. Varying infrastructure models, geographies, and product types drastically alter how to interpret the number at the end of an equation.
As the current market increases the pressure on SaaS companies to be data-driven and prioritize efficient, durable growth, CEOs and leaders must make sure they’re considering the right set of benchmarks. I couldn’t agree more with sociologist Alvin Gouldner who said “Context is everything.”

