The Complete Guide to User Engagement Metrics
User engagement metrics provide insight into a user’s product journey and interaction patterns. They are crucial for understanding product success, identifying opportunities for increasing trial conversion rates and reducing customer churn. In fact, quantifying user engagement is so critical that identifying the right metrics can mean the difference between success or failure of your product. This guide explains the most important user engagement metrics and provides best practices for taking action on their insights.
Important User Engagement Metrics
The table below provides an overview of important user engagement metrics, divided into four categories:
- User Activity Metrics: how often users engage with or return to your product
- User Session Metrics: how user engagement breaks down into sessions
- Feature Engagement Metrics: how users interact with features of your product
- User Journey Metrics: how users progress through key product experiences
| Category | Metric | Description |
|---|---|---|
| User Activity | Daily Active Users (DAU)
Weekly Active Users (WAU) Monthly Active Users (MAU) |
The number of active product users in a given window of time (ie. day, week, or month) |
| Product Stickiness | The percentage of users who return to the product within a given period of time. | |
| User Session | Average Session Length | The average time spent using your product in a given session |
| Average User Sessions | The average number of sessions per user in a given period of time | |
| Feature Engagement | Feature Activation Rate | The percentage of all active product users that have realized the value of the feature |
| Feature Adoption Rate | The percentage of all active product users that have integrated the feature into their workflow | |
| Feature Retention Rate | The percentage of feature users who continue using the feature over a given time period | |
| User Journey | Funnel Completion Rate | The percentage of users who start a particular user journey and complete it |
| Funnel Average Time to Complete | The average time it takes users to complete a user journey from start to finish |
User Engagement Metrics Explained
Let’s take a closer look at each user engagement metric, how it’s defined, and in which situations can it be used most effectively.
User Activity Metrics
Daily/Weekly/Monthly Active Users (DAU/WAU/MAU)
Definition: Number of active users per day/week/month.
Perhaps the most popular of all engagement metrics, DAU (Daily Active Users), WAU (Weekly Active Users), and MAU (Monthly Active Users) measure the number of users actively using your product within a window of time.
It’s important to carefully define what constitutes an active user in your product. Many PMs will track any user interaction as active. Others will only consider meaningful user actions in their product (i.e. those that contribute to the successful use of the product).
Product Stickiness
Definition: Number of daily active users (DAU) / monthly active users (MAU).
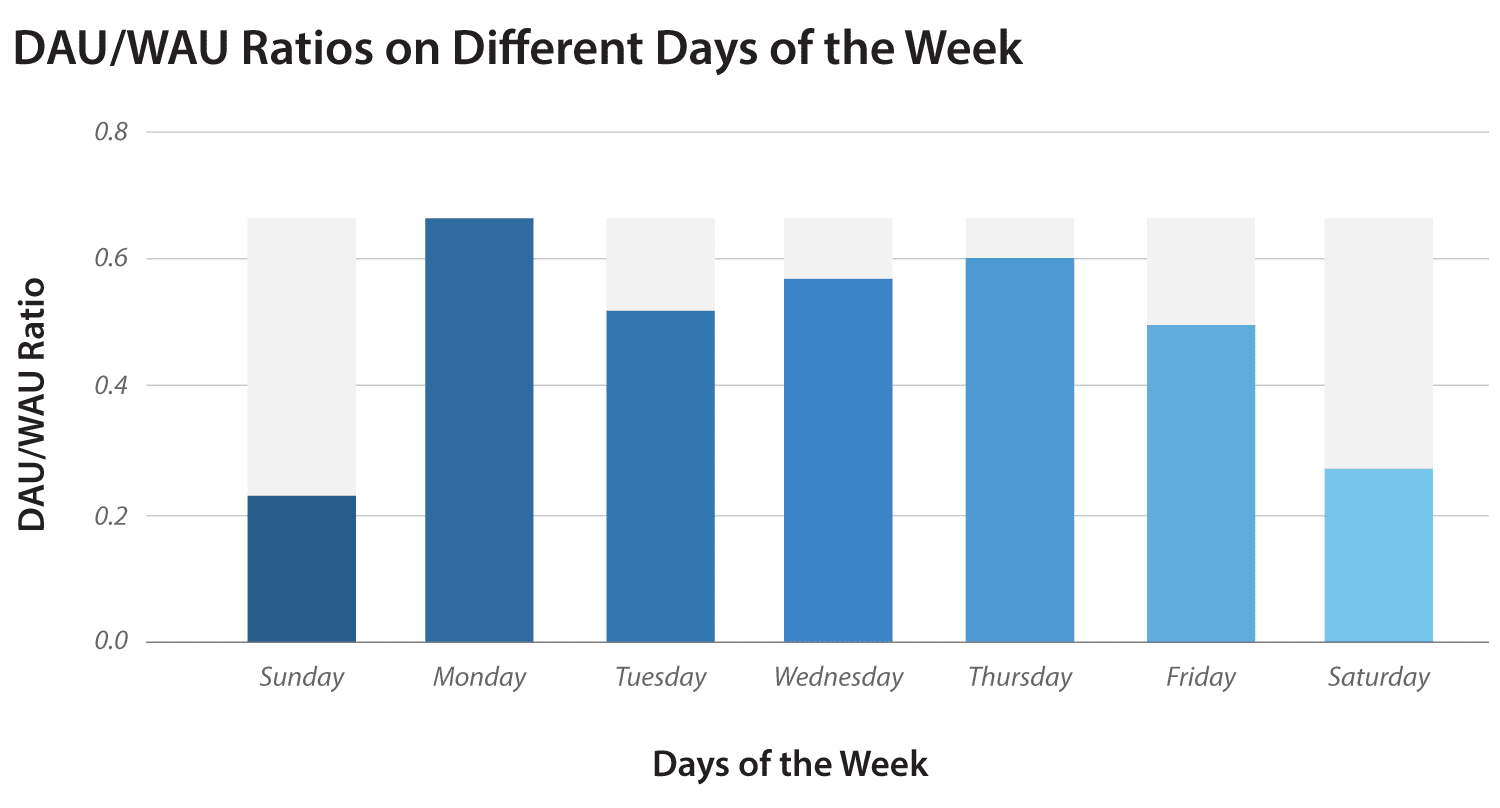
Stickiness is a measure of how often users return to use your product within a given time period. A popular metric for tracking this is the DAU/MAU ratio (i.e., Daily Active Users divided by Monthly Active Users). A higher number indicates that users are returning to your product more frequently.

Image showing sample daily DAU/WAU ratios
For many SaaS B2B products, the DAU/WAU ratio is a particularly interesting metric to follow. Weekly active users who are also active daily (i.e., the DAU/WAU ratio is high), use your product everyday. This means that your product likely performs a core function in their workflow.
|
Platform
|
Out-of-the-Box KPIs
|
Segmentation
|
Feature-Level Adoption & Retention Analysis
|
Cross-Channel User Engagements
|
Engagement Impact Analysis
|
A.I-Powered Product Feature Mapping
|
Mobile Application Support
|
|---|---|---|---|---|---|---|---|
|
Gainsight
|
✔
|
✔
|
✔
|
✔
|
✔
|
✔
|
✔
|
|
Heap
|
✔
|
✔
|
✔
|
✔
|
|||
|
Pendo
|
✔
|
✔
|
User Session Metrics
Average Session Length
Definition: Average length of time of a user session.
Average session length refers to how long a user spends using your product in a single session. When measuring session length, it’s essential to define the length of a successful session for your product. For a social media product, the answer may be “as long as possible,” since longer sessions result in more opportunities to present ads. For some use-cases of SaaS business products, shorter sessions might be ideal if they reflect users completing their tasks with less friction.
Average User Sessions
Definition: Total sessions / total users
This metric reveals, on average, how often users are accessing your product in a given period of time. Multiplying the number of average sessions by the average session length will provide the average total time that users spend on your product within a window of time.
Feature Engagement Metrics
Feature Activation Rate
Definition: Percentage of active product users that have realized the value of a feature (ie. reached the feature’s “aha moment”)
The feature activation rate tells you how many users have discovered a specific feature and completed a milestone or series of milestones that define value realization. Typically, the time condition for this metric corresponds to something meaningful for the product. For example, a SaaS product might match the trial period’s length to the time it takes a user to realize feature value.
A low feature activation rate might indicate that users are having a difficult time locating the feature in the UI. In this case, consider aiding discovery by using product tours or banners.
If the activation rate remains low for a feature, even with improved discovery, perhaps the feature is not interesting or useful for your users and could be considered for removal or replacement.
Feature Adoption Rate
Definition: Number of active users using a particular feature / number of active users using the product.
Adoption is achieved when a user integrates a specific feature into their workflow. This usually means that a user interacts with this feature consistently over a period of time. You can think of adoption as a feature’s own user base. Different features will overlap and share active users and you will likely find that nearly all of your users are using one or two of your features. Stack ranking features in this way can provide a sense of importance for each feature. Features attracting a small percentage of active users might be targeted towards power users or are simply not contributing to the success of the product.
Feature Retention Rate
Definition: Percentage of users who try a feature and return to use that feature again within a given period of time.
Feature retention tells you how valuable a feature is, based on the assumption that users who have tried it will only return if their initial experience was positive.
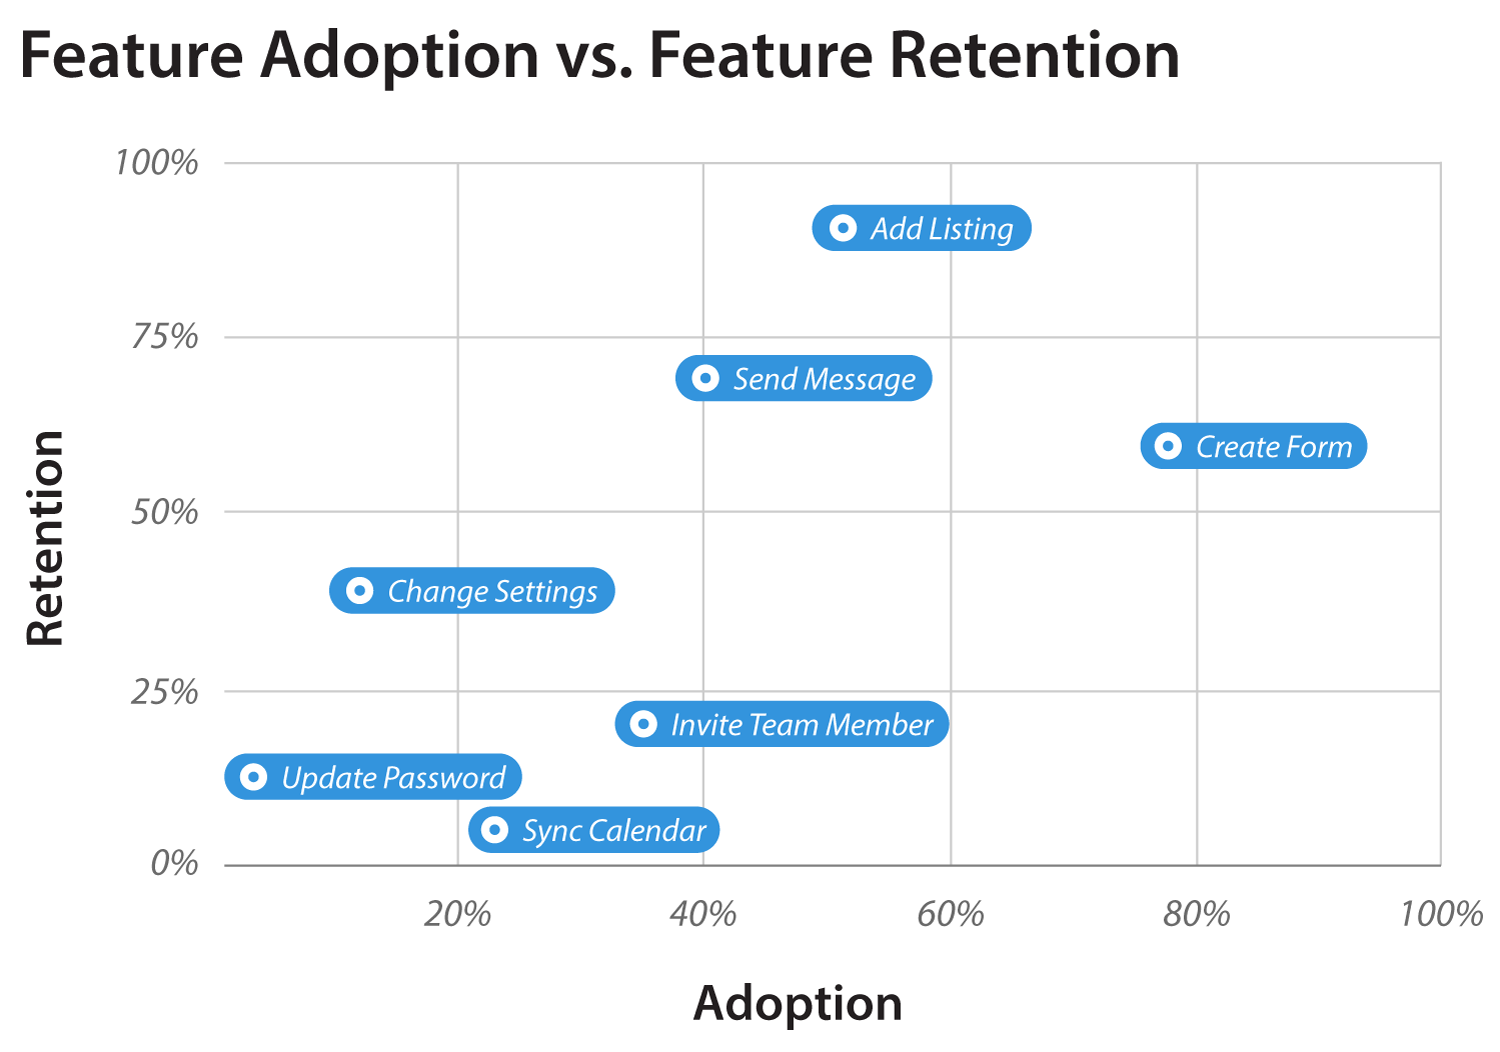
Features with high retention but low adoption rates are candidates for additional promotion in the product. If a feature is valuable to users who have discovered it, it will likely be valuable to those who haven’t.
On the other hand, features with high adoption but low retention may need improvements in UX or a complete reassessment of their value proposition.
An interesting analytical exercise for a SaaS product is to benchmark the retention of features against one another and also against overall product retention. WIth this data, you can assess what the product’s core features really are.
User Journey Metrics
Funnel Completion Rate
Definition: The percentage of users who complete a particular user journey out of all users who have started it.
Funnels typically define a desirable user journey, consisting of several steps a user must take to have a successful experience. The funnel completion rate measures the proportion of users who complete a journey vs. those who have started it.
One common application of the funnel completion rate metric is onboarding. This user experience metric can answer the question: “what % of users who start the onboarding process finish it?” and can lead to other important questions like: “where along the way do they get stuck and drop out?”
Funnel Average Time to Completion
Definition: The average time it takes users to complete a user journey from start to finish
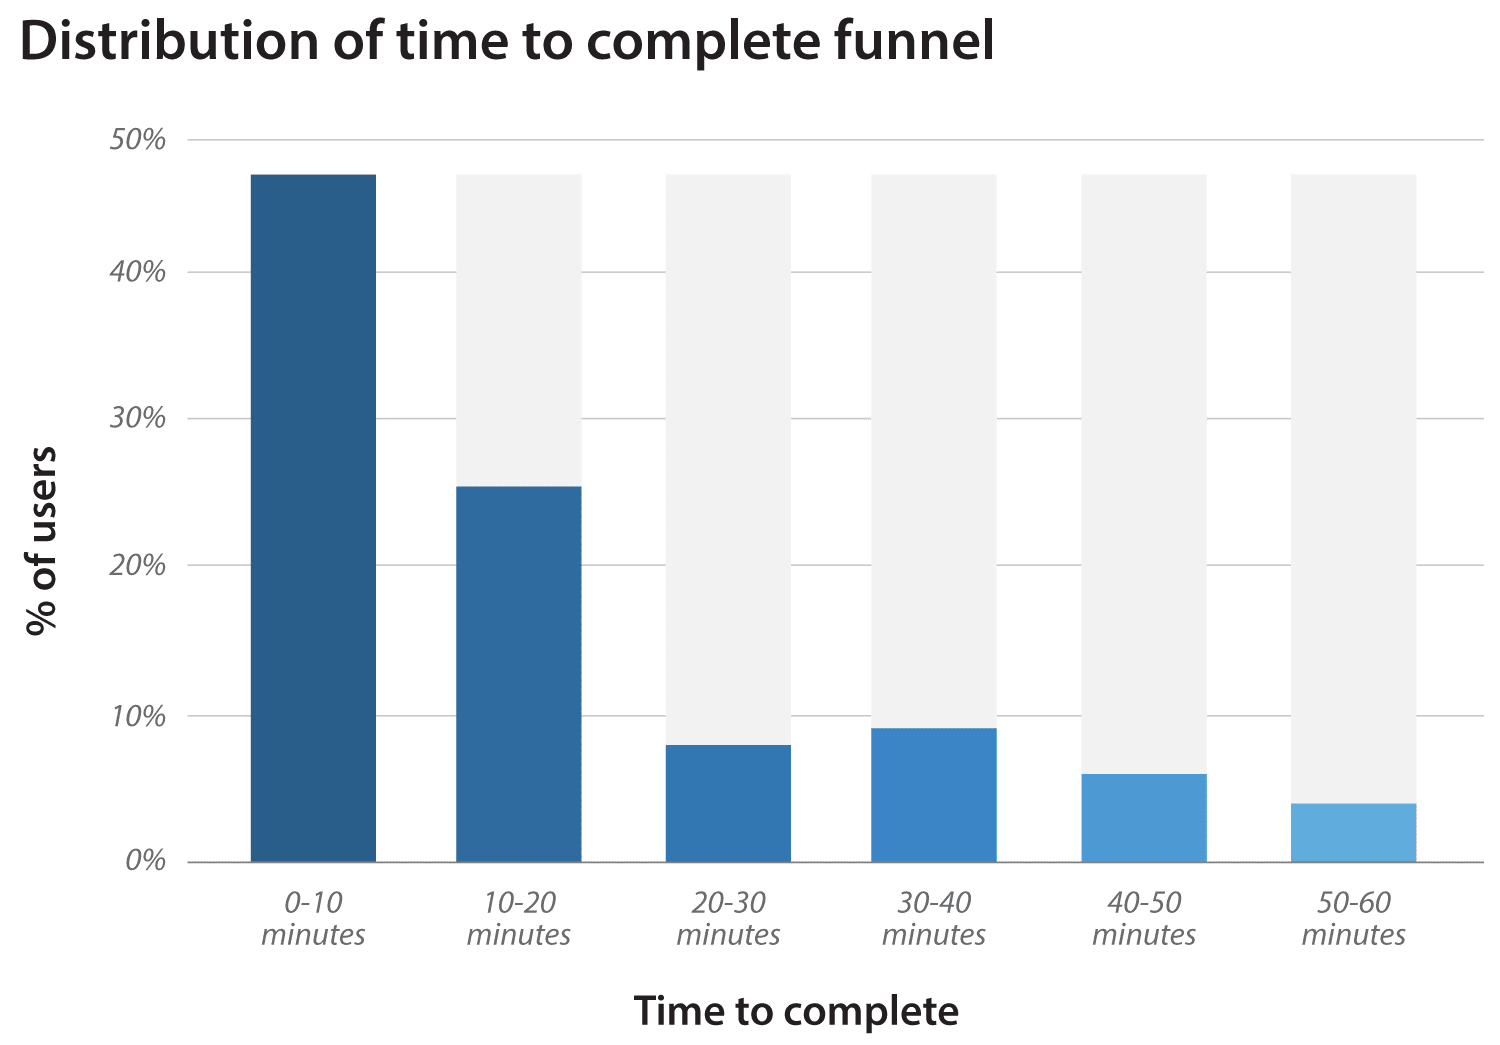
In addition to the completion rate, it can be interesting to look at the average time it takes a user to complete a funnel.

Image showing sample distribution of funnel completion times
Let’s consider the onboarding example again. If one step is very time-consuming — like manually entering a lot of data — it will increase the average time it takes to complete the funnel. When looking at the distribution of funnel completion times, you’ll often see the majority of users take a short time with a long tail of users taking more time. In most cases, this can be considered a “healthy” pattern. Conversely, a shift in distribution towards longer times may be an indication of unnecessary friction in your product.
Best Practices for Working with User Engagement Metrics
Now that you know the primary metrics for measuring user engagement, here are some quick pointers for taking action based on your measurements.
Segment Your Users
If you notice a metric is higher or lower than you expected, it’s a good idea to segment your users and examine the metric for each segment.
For example, if you suddenly notice more active users, you could segment by country to potentially identify regional growth.
Implement In-App Tours & Surveys
An in-app tour can help boost adoption of underperforming features. Try measuring user engagement before and after introducing the tour to quantify its impact.
Similarly, if you see users dropping off at particular points in a funnel, consider a survey to help identify where the UX is failing.
Run A/B Tests
Try to run A/B tests as you make changes to your user experience. An A/B test enables you to compare user engagement metrics for users that have experienced a change to the product versus those who haven’t. A/B tests can also help ensure that measured differences in engagement are attributed to a product change and not to external factors, like simultaneously occurring marketing campaigns.
Make a Feature Adoption vs. Retention Map
Feature adoption vs retention maps can provide a treasure trove of insight. Map each feature corresponding to its known metrics, with adoption on one axis and retention on another. Features with low adoption but high retention should be considered candidates for promotion (e.g., via in-app banners or tours). Features with high adoption but low retention may need a rethink. Perhaps they’re overly promoted or are under-delivering on their promise.

Image showing sample feature adoption vs retention map
Conclusion
User engagement metrics arm product managers with many ways to examine how their product is being used. They force PMs to think creatively about their product and encourage analytical techniques that can lead to key insights, driving product improvements.


